Question 4: Using Excel, conduct a NHST to determine whether there is a correlation in the population. Use a 0.05 significance level. Use the Excel file: Assignment8_Spring22.xlsx a. Test Set-Up: What type of Null Hypothesis Test should you use? Is this a left-tailed, two-tailed, or right-tailed test? Place an "X" in the appropriate box: Left-Tail Two-Tail Right-Tail This is a t-test to determine whether there is a correlation in the population. Here is the formula for the Test Statistic: r/n-2 t= V1-r b. What is/are the critical value(s) for t? Degrees of freedom equals n - 2. Use a 5% significance level. How many critical values are there? Place an “X" in the appropriate box: One Two What is (are) the critical value(s)? Round off your answer to three digits passed the decimal point. Enter the value or values in this box: Write the Null & Alternate Hypotheses (Follow the examples shown in Clear-Sighted Statistics. Use the appropriate Greek letters and mathematical symbols). Họ: с. H1: Here are the Greek Letters and mathematical symbols. Copy and paste the correct symbols. Mathematical Symbols %3D > < Greek Letters Σ V
Question 4: Using Excel, conduct a NHST to determine whether there is a correlation in the population. Use a 0.05 significance level. Use the Excel file: Assignment8_Spring22.xlsx a. Test Set-Up: What type of Null Hypothesis Test should you use? Is this a left-tailed, two-tailed, or right-tailed test? Place an "X" in the appropriate box: Left-Tail Two-Tail Right-Tail This is a t-test to determine whether there is a correlation in the population. Here is the formula for the Test Statistic: r/n-2 t= V1-r b. What is/are the critical value(s) for t? Degrees of freedom equals n - 2. Use a 5% significance level. How many critical values are there? Place an “X" in the appropriate box: One Two What is (are) the critical value(s)? Round off your answer to three digits passed the decimal point. Enter the value or values in this box: Write the Null & Alternate Hypotheses (Follow the examples shown in Clear-Sighted Statistics. Use the appropriate Greek letters and mathematical symbols). Họ: с. H1: Here are the Greek Letters and mathematical symbols. Copy and paste the correct symbols. Mathematical Symbols %3D > < Greek Letters Σ V

Big Ideas Math A Bridge To Success Algebra 1: Student Edition 2015
1st Edition
ISBN:9781680331141
Author:HOUGHTON MIFFLIN HARCOURT
Publisher:HOUGHTON MIFFLIN HARCOURT
Chapter4: Writing Linear Equations
Section: Chapter Questions
Problem 14CR

Related questions
Question
Please answer this questions asap please
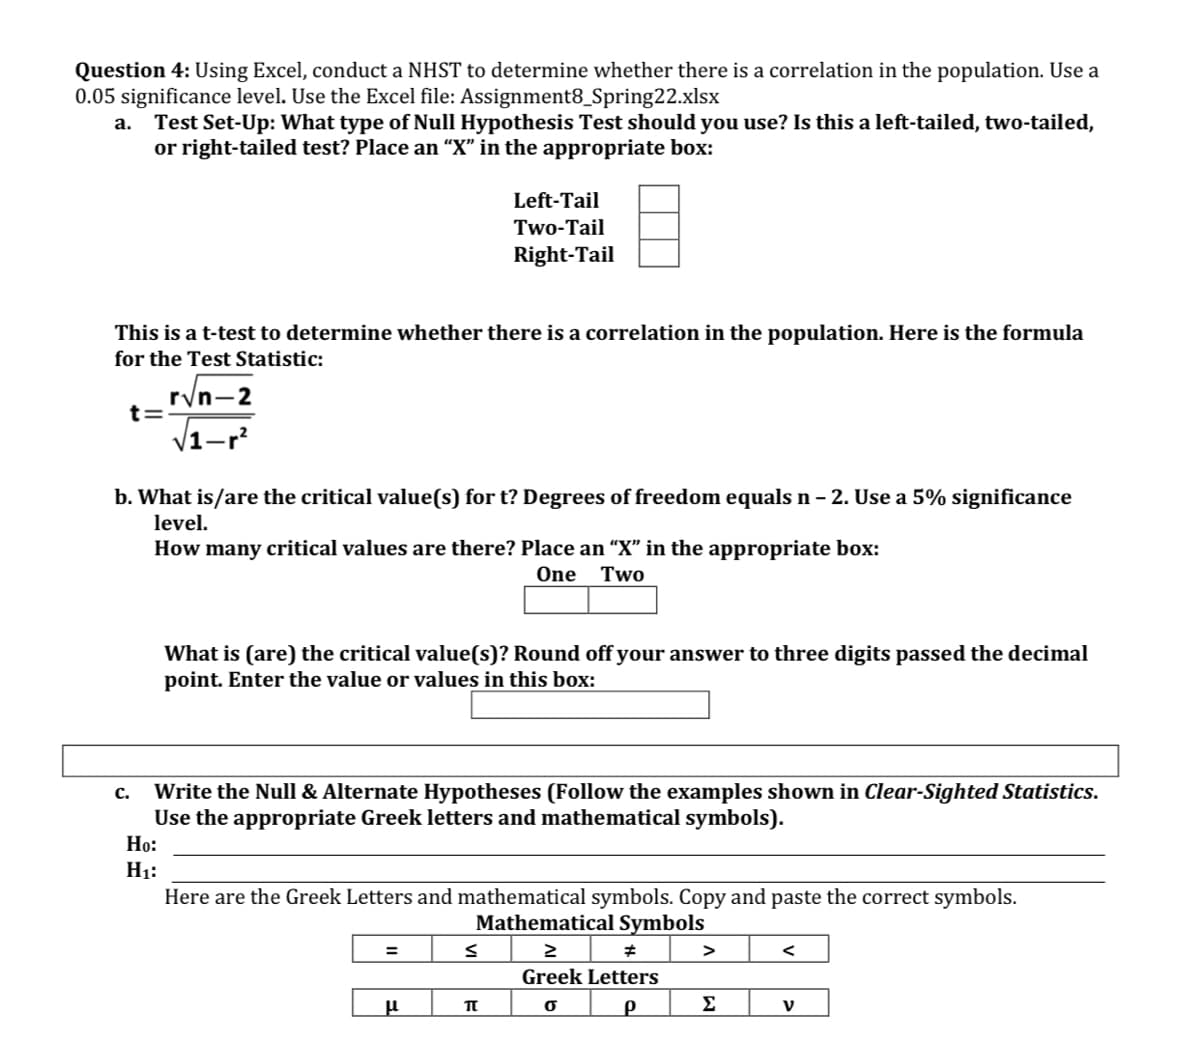
Transcribed Image Text:Question 4: Using Excel, conduct a NHST to determine whether there is a correlation in the population. Use a
0.05 significance level. Use the Excel file: Assignment8_Spring22.xlsx
a. Test Set-Up: What type of Null Hypothesis Test should you use? Is this a left-tailed, two-tailed,
or right-tailed test? Place an “X" in the appropriate box:
Left-Tail
Two-Tail
Right-Tail
This is a t-test to determine whether there is a correlation in the population. Here is the formula
for the Test Statistic:
ryn-2
t=
V1-r?
b. What is/are the critical value(s) for t? Degrees of freedom equals n - 2. Use a 5% significance
level.
How many critical values are there? Place an "X" in the appropriate box:
One
Two
What is (are) the critical value(s)? Round off your answer to three digits passed the decimal
point. Enter the value or values in this box:
Write the Null & Alternate Hypotheses (Follow the examples shown in Clear-Sighted Statistics.
Use the appropriate Greek letters and mathematical symbols).
Но:
с.
H1:
Here are the Greek Letters and mathematical symbols. Copy and paste the correct symbols.
Mathematical Symbols
>
Greek Letters
Σ
V
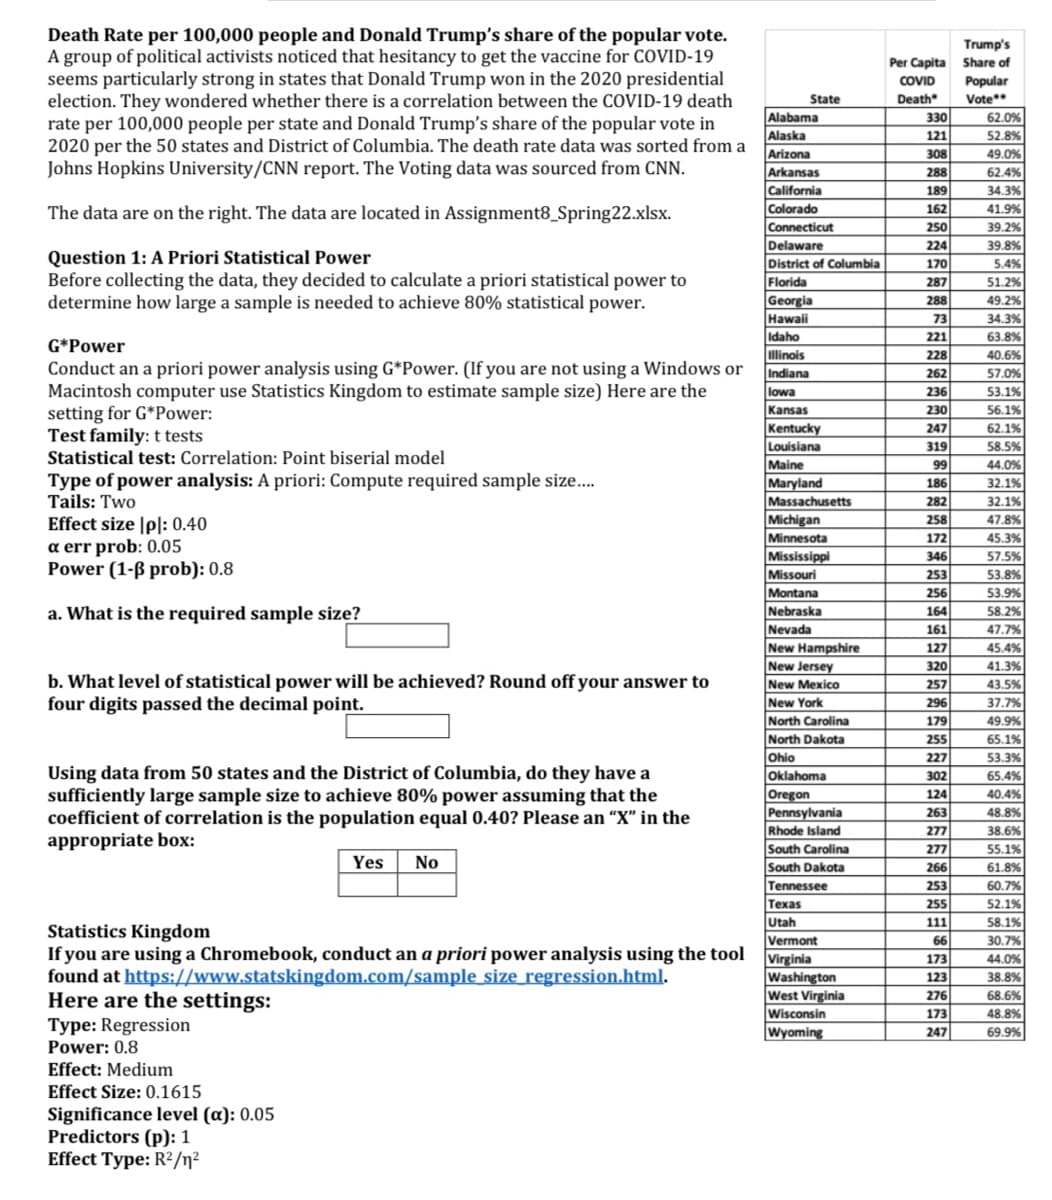
Transcribed Image Text:Death Rate per 100,000 people and Donald Trump's share of the popular vote.
A group of political activists noticed that hesitancy to get the vaccine for COVID-19
seems particularly strong in states that Donald Trump won in the 2020 presidential
election. They wondered whether there is a correlation between the COVID-19 death
rate per 100,000 people per state and Donald Trump's share of the popular vote in
2020 per the 50 states and District of Columbia. The death rate data was sorted from a
Johns Hopkins University/CNN report. The Voting data was sourced from CNN.
Trump's
Per Capita Share of
Popular
Vote*
COVID
State
Death
Alabama
Alaska
Arizona
Arkansas
California
Colorado
330
62.0%
121
52.8%
308
288
49.0%
62.4%
189
34.3%
The data are on the right. The data are located in Assignment8_Spring22.xlsx.
162
41.9%
Connecticut
Delaware
District of Columbia
Florida
Georgia
Hawaii
250
39.2%
224
39.8%
Question 1: A Priori Statistical Power
Before collecting the data, they decided to calculate a priori statistical power to
determine how large a sample is needed to achieve 80% statistical power.
170
5.4%
287
51.2%
288
49.2%
73
34.3%
221
Idaho
linois
Indiana
63.8%
G*Power
228
40.6%
Conduct an a priori power analysis using G*Power. (If you are not using a Windows or
Macintosh computer use Statistics Kingdom to estimate sample size) Here are the
setting for G*Power:
Test family: t tests
Statistical test: Correlation: Point biserial model
262
57.0%
53.1%
lowa
Kansas
Kentucky
Louisiana
Maine
Maryland
Massachusetts
236
230
56.1%
247
62.1%
319
58.5%
99
44.0%
Type of power analysis: A priori: Compute required sample size.
Tails: Two
32.1%
32.1%
186
282
Michigan
Minnesota
258
47.8%
Effect size |pl: 0.40
a err prob: 0.05
Power (1-ß prob): 0.8
172
346
45.3%
Mississippi
Missouri
Montana
Nebraska
Nevada
New Hampshire
New Jersey
57.5%
253
53.8%
256
53.9%
a. What is the required sample size?
164
58.2%
161
47.7%
127
45.4%
320
41.3%
b. What level of statistical power will be achieved? Round off your answer to
four digits passed the decimal point.
New Mexico
257
43.5%
New York
North Carolina
North Dakota
Ohio
Oklahoma
296
37.7%
179
49.9%
255
65.1%
227
53.3%
Using data from 50 states and the District of Columbia, do they have a
sufficiently large sample size to achieve 80% power assuming that the
coefficient of correlation is the population equal 0.40? Please an “X" in the
appropriate box:
302
65.4%
Oregon
Pennsylvania
Rhode Island
South Carolina
South Dakota
Tennessee
Техas
Utah
Vermont
124
40.4%
263
48.8%
277
38.6%
277
55.1%
Yes
No
266
61.8%
253
60.7%
255
52.1%
111
58.1%
Statistics Kingdom
If you are using a Chromebook, conduct an a priori power analysis using the tool
found at https://www.statskingdom.com/sample size regression.html.
Here are the settings:
Type: Regression
Power: 0.8
66
30.7%
Virginia
Washington
West Virginia
Wisconsin
Wyoming
173
44.0%
123
38.8%
276
68.6%
173
48.8%
247
69.9%
Effect: Medium
Effect Size: 0.1615
Significance level (a): 0.05
Predictors (p): 1
Effect Type: R²/n²
Expert Solution
This question has been solved!
Explore an expertly crafted, step-by-step solution for a thorough understanding of key concepts.

Step by step
Solved in 3 steps

Recommended textbooks for you
Big Ideas Math A Bridge To Success Algebra 1: Stu…
Algebra
ISBN:
9781680331141
Author:
HOUGHTON MIFFLIN HARCOURT
Publisher:
Houghton Mifflin Harcourt
Big Ideas Math A Bridge To Success Algebra 1: Stu…
Algebra
ISBN:
9781680331141
Author:
HOUGHTON MIFFLIN HARCOURT
Publisher:
Houghton Mifflin Harcourt