Give an interpretation for the following histogram.

Big Ideas Math A Bridge To Success Algebra 1: Student Edition 2015
1st Edition
ISBN:9781680331141
Author:HOUGHTON MIFFLIN HARCOURT
Publisher:HOUGHTON MIFFLIN HARCOURT
Chapter11: Data Analysis And Displays
Section: Chapter Questions
Problem 10CT

Related questions
Question
Give an interpretation for the following histogram.
Transcribed Image Text:16
14
15
12
13
10
11
144.5 – 150.5 150.6 – 156.6 156.7 – 162.7 162.8 – 168.8 168.9 – 174.9 175.0 - 181.0 181.1 - 187.1
Height Class (cm)
BIAL
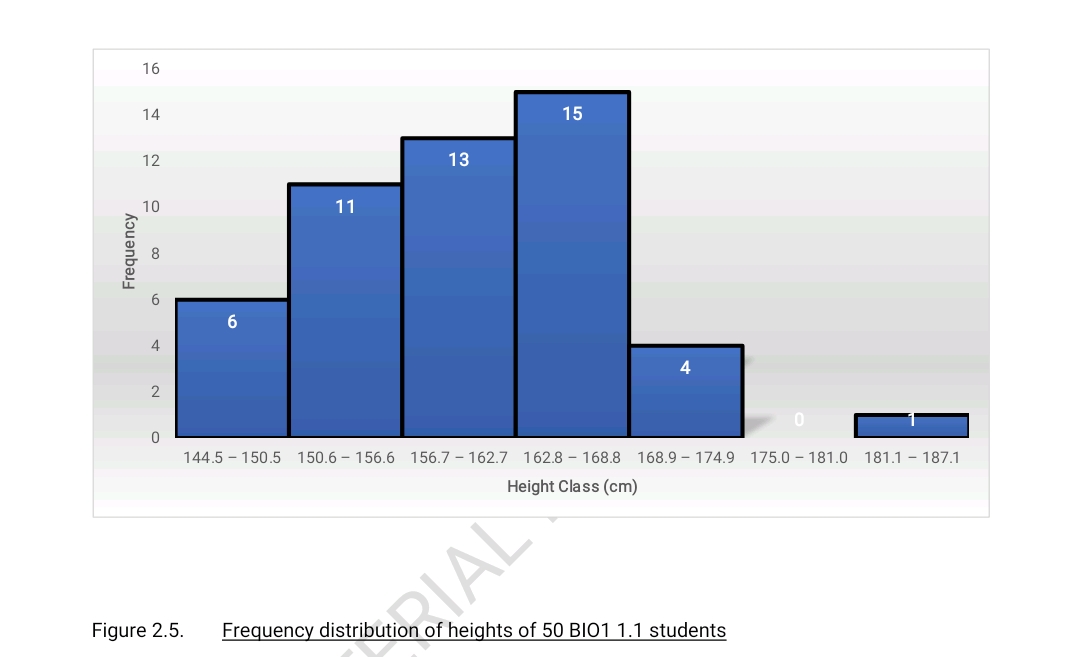
Figure 2.5.
Frequency distribution of heights of 50 BI01 1.1 students
Frequency
Expert Solution
This question has been solved!
Explore an expertly crafted, step-by-step solution for a thorough understanding of key concepts.

Step by step
Solved in 2 steps with 1 images

Recommended textbooks for you
Big Ideas Math A Bridge To Success Algebra 1: Stu…
Algebra
ISBN:
9781680331141
Author:
HOUGHTON MIFFLIN HARCOURT
Publisher:
Houghton Mifflin Harcourt
Big Ideas Math A Bridge To Success Algebra 1: Stu…
Algebra
ISBN:
9781680331141
Author:
HOUGHTON MIFFLIN HARCOURT
Publisher:
Houghton Mifflin Harcourt