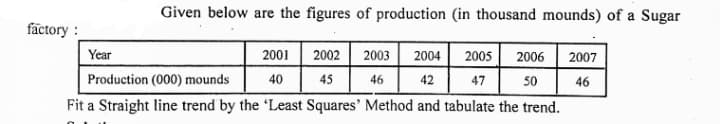
Given below are the figures of production (in thousand mounds) of a Sugar factory : Year 2001 2002 2003 2004 2005 2006 2007 50 Fit a Straight line trend by the 'Least Squares' Method and tabulate the trend. Production (000) mounds 40 45 46 42 47 46
Given below are the figures of production (in thousand mounds) of a Sugar factory : Year 2001 2002 2003 2004 2005 2006 2007 50 Fit a Straight line trend by the 'Least Squares' Method and tabulate the trend. Production (000) mounds 40 45 46 42 47 46

Linear Algebra: A Modern Introduction
4th Edition
ISBN:9781285463247
Author:David Poole
Publisher:David Poole
Chapter7: Distance And Approximation
Section7.3: Least Squares Approximation
Problem 5EQ

Related questions
Question
Transcribed Image Text:Given below are the figures of production (in thousand mounds) of a Sugar
factory :
Year
2001 2002 2003
2004
2005
2006
2007
50
Fit a Straight line trend by the 'Least Squares' Method and tabulate the trend.
Production (000) mounds
40
45
46
42
47
46
Expert Solution
This question has been solved!
Explore an expertly crafted, step-by-step solution for a thorough understanding of key concepts.

This is a popular solution!

Trending now
This is a popular solution!

Step by step
Solved in 2 steps with 2 images

Recommended textbooks for you
Linear Algebra: A Modern Introduction
Algebra
ISBN:
9781285463247
Author:
David Poole
Publisher:
Cengage Learning

Elementary Linear Algebra (MindTap Course List)
Algebra
ISBN:
9781305658004
Author:
Ron Larson
Publisher:
Cengage Learning

Big Ideas Math A Bridge To Success Algebra 1: Stu…
Algebra
ISBN:
9781680331141
Author:
HOUGHTON MIFFLIN HARCOURT
Publisher:
Houghton Mifflin Harcourt
Linear Algebra: A Modern Introduction
Algebra
ISBN:
9781285463247
Author:
David Poole
Publisher:
Cengage Learning
Elementary Linear Algebra (MindTap Course List)
Algebra
ISBN:
9781305658004
Author:
Ron Larson
Publisher:
Cengage Learning
Big Ideas Math A Bridge To Success Algebra 1: Stu…
Algebra
ISBN:
9781680331141
Author:
HOUGHTON MIFFLIN HARCOURT
Publisher:
Houghton Mifflin Harcourt