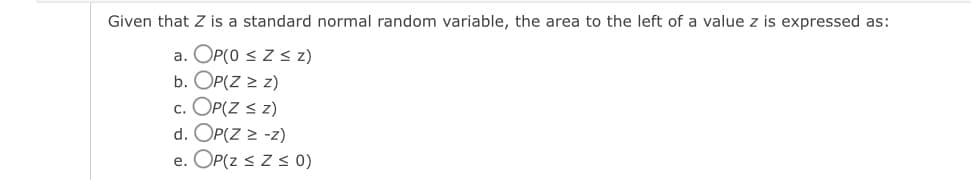
Given that Z is a standard normal random variable, the area to the left of a value z is expressed as: a. OP(0 ≤ Z ≤ z) b. OP(Z > Z) c. OP(Z < Zz) d. OP(Z > -z) e. OP(Z < Z ≤ 0)


Q: Example 5: Find a 90% confidence interval for the mean difference in the mileage obtained for tires…
A: Given: 50 45 50 50 100 100 100 -10 75 -25 0 25 75 25 50 40 35
Q: 1. Wellstone Inc. produces and markets replacement covers for cell phones in a variety of colors.…
A: Hi! Thank you for the question, As per the honor code, we are allowed to answer three sub-parts of a…
Q: The amount of coffee that people drink per day is normally distributed with a mean of 17 ounces and…
A: Given data μ=17 σ=5 Normal distribution n = 13
Q: Listed below are the amounts (dollars) it costs for marriage proposal packages at different…
A: x x2 40 1600 50 2500 50 2500 55 3025 60 3600 75 5625 90…
Q: QUESTION 42 "An independent samples study exhibted the following sample characteristics: Sample 1, n…
A: We have given that, For sample 1, n1 = 52, SS1 = 296.3 And n2 = 55, SS2 =256.4 Then, We will find…
Q: QUESTION 30 A between-subjects ANOVA was found to be significant, with a SS-Between = 225.56 and…
A: Effect size is a statistical concept that measures the strength of the relationship between two…
Q: The number of tickets purchased by an individual for Beckham Colleges holiday music festival is a…
A: GivenA random x ~Uniform(5,15)f(x)=1b-a ; a<x<bf(x)=115-5f(x)=110 ; 5<x<15
Q: This is represented by alpha in statistics. It is a probability and so can only be between 0 and 1.…
A: Concept: type 1 error is the probability of rejecting the null hypothesis when it is actually true.
Q: The following is a set of data for a population with N=10. 15 2 1 3 10 9 9 10 9 8 a. Compute the…
A: Given that N = 10 x x2 15 225 2 4 1 1 3 9 10 100 9 81 9 81 10 100 9 81 8 64…
Q: population of values has a normal distribution with μ=191.3 and σ=79.3.You intend to draw a random…
A: given data A population of values has a normal distribution μ=191.3σ=79.3n=239here we have to find…
Q: 2. A box contains ten marbles: two red, five green, and three blue. a. Consider an experiment that…
A: Solution: a) Total no. of marbles= 10 red=2 green=5 blue=3
Q: Find the interval containing the middle-most 94% of sample means:
A: Given: Mean, μ=210standard deviation, σ=20Sample size, n=32
Q: Suppose that BC financial aid alots a textbook stipend by claiming that the average textbook at BC…
A:
Q: A psychologist is interested in constructing a 99% confidence interval for the proportion of people…
A: given data construct 99% ci for p n = 845x = 75p^ = xn = 75845= 0.0888α=1-0.99 = 0.01
Q: QUESTION 16 "An ANOVA is used to evaluate the differences among 5 treatment conditions with a sample…
A: Given that Number of treatment = k = 5 Sample = n = 16
Q: Find the regression equation, letting the first variable be the predictor (x) variable. Using the…
A: The question is about regression Given : To find : 1 ) Reg. eq. 2 ) pred. age best actor given…
Q: ou wish to test the following claim (HaHa) at a significance level of α=0.005α=0.005.…
A: Given that n1=544p1=0.441n2=328p2=0.345α=0.005
Q: QUESTION 17 Calculate the weighted mean for sample 1 and sample 2. Sample 1 has 14 scores with a…
A: It is given that For sample 1, sample size n1 = 14, sample mean = M1 = 28.20 For sample 2, sample…
Q: A population consists of value 3. 5. 7 and 9. Take all possible simple random samples of size 2…
A: Given: The population consists of values 3, 5, 7, and 9.
Q: "A set of n = 60 pairs of X and Y scores has SSX = 29.79, SSY = 31.43, and SP = 20.55. What is the…
A: It is given that SSX = 29.79 SSY = 31.43, SP = 20.55
Q: For each of the following pairs of variables, is there likely to be a positive association, a…
A: Here for each of the given question we should check if there is a positive, negative or no…
Q: Problem 4 In a poker game, Melanie has a very strong hand and bets $5. The probability that Ben has…
A: The probability of Ben has better hand is 0.04 Ben has a better hand he would raise with probability…
Q: You wish to test the following claim (H₁) at a significance level of a = 0.001. H₂:₁ = ₂ Ha: <H₂ You…
A: Given: H0:μ1=μ2 Ha:μ1<μ2 (claim) Required: To test the claim at a significance level α=0.001
Q: There are three separate, equal-size boxes, and inside each box there are four separate small boxes,…
A: Here, Number of Big boxes =3 Small boxes: Inside each box there are four separate box. i.e. 3 x 4=…
Q: A 1 total_cases_per_million 2 3 Mean 4 Standard Error 5 Median 6 Mode 7 Standard Deviation B C…
A: Given the two variables: Total cases per million and total deaths
Q: Question 19 for the linear equation y= 15x + 3, if x increases by 1 point, how much will y…
A: The given regression equation is: y=15x+3. The regression equation is given for y (i.e., the…
Q: Refer to the table below, the average number of chocolate chips per cookie in two competing…
A: The distributions of chocolate chips, that is obtained for the Brands A and B at the sample level…
Q: In a survey, 18 people were asked how much they spent on their child's last birthday gift. The…
A: Given: Sample size, n is 18 Sample mean, x¯=39 Sample standard deviation, s=18 Confidence level is…
Q: Which of the following correctly describes the nature of discrete quantitative variables? a. They…
A: The objective is to identify the statement that correctly describes the nature of discrete…
Q: Chauncey Billups, a current shooting guard for the Los Angeles Clippers, has a career free-throw…
A: given data Chauncey Billups , acirrent shooting guard for the Los Angeles Cliipers,has a carrer…
Q: Chauncey Billups, a current shooting guard for the Los Angeles Clippers, has a career free-throw…
A: Given that n = 6 , p = 89.4% = 0.894 , q = 1 - p = 1 - 0.894 = 0.106 p = Probability of free…
Q: 2.4. How many parameters must be estimated? 2.5. Give the fitted response function used to get the…
A: 2.4GivenThe degree of freedom for regression from given output a=6a=k-1, where k is number of…
Q: A college claims that the proportion, p, of students who commute more than fifteen miles to school…
A: Givensample size(n)=275x=36significance level=0.05
Q: 1.4. If the following observations of X5 were taken, show which values will now be used in the…
A: 1.4) If the following observations of X5 were taken, we need to show which values will be used in…
Q: calculate the mean squared between treatments value for a repeated measures ANOVA with 26…
A: Introduction: It is required to calculate the mean squared between treatments value in case of a…
Q: Given that the height of college boys is normally distributed with mean 5'-2" and standard deviation…
A: GivenMean(μ)=5'2" =62 inches (1 foot = 12 inches)standard deviation(σ)=4"=4 inchesThe Minimum…
Q: Suppose that BC financial aid alots a textbook stipend by claiming that the average textbook at BC…
A: given data claim : μ=68.85 n = 90;df= n-1 = 89 x¯ = 67.05s = 15.6 95% ci for μ.
Q: The following three independent random samples are obtained from three normally distributed…
A: The groups are internship, co-op and work study.
Q: 9:4 (b). The numbers 3, 2, 5.8, 7.9 and 4.5, have frequencies x, (x + 2), (x + 3) and (x + 6)…
A: Concept: Arithmetic mean= sum of all (frequency*number)/sum of all frequency
Q: QUESTION 38 A cognitive psychologist believes that a group of individuals will have significantly…
A: Test Statistic: A test statistic estimates how precisely a collection of information agrees with the…
Q: On the midnight shift, the number of patients with head trauma in an emergency room has the…
A:
Q: QUESTION 34 "If the y-intercept is -10.14 and the regression coefficient is 1.39, the predicted…
A:
Q: You are conducting a test of homogeneity for the claim that two different populations have the same…
A: The hypotheses for the homogeneity test are as follows: H0:The proportions are same for the two…
Q: QUESTION 59 A repeated measures ANOVA using 15 participants observed a df-within = 42 and SS-Error =…
A: Given that dfwithin = 42 , SSerror = 20.51
Q: The following is a snippet of a data set on top-selling laptops on Amazon: Top-Selling Laptops on…
A: The data set on top-selling laptops are given.
Q: Joan recorded the number of weeks that a patient was prescribed a medication after visiting the…
A: Since we know that variable is a value or quantity that can change, depending upon the given…
Q: QUESTION 11 The Pearson s product moment correlation coefficient (r) is derived by calculating the…
A: Given that The Pearson's product moment correlation coefficient ( r ) is derived by
Q: Question: If two events, A and B, are independent, which of the following statements is true? A:…
A: Given;We have two events A and B. both events A and B are indepedent.
Q: The following is a set of data for a population with N=10. 15 2 1 3 10 9 9 10 9 8 9 a. Compute the…
A: x x2 15 225 2 4 1 1 3 9 10 100 9 81 9 81 10 100…
Q: You are conducting a test of homogeneity for the claim that two different populations have the same…
A:

Step by step
Solved in 4 steps with 1 images

- Olympic Pole Vault The graph in Figure 7 indicates that in recent years the winning Olympic men’s pole vault height has fallen below the value predicted by the regression line in Example 2. This might have occurred because when the pole vault was a new event there was much room for improvement in vaulters’ performances, whereas now even the best training can produce only incremental advances. Let’s see whether concentrating on more recent results gives a better predictor of future records. (a) Use the data in Table 2 (page 176) to complete the table of winning pole vault heights shown in the margin. (Note that we are using x=0 to correspond to the year 1972, where this restricted data set begins.) (b) Find the regression line for the data in part ‚(a). (c) Plot the data and the regression line on the same axes. Does the regression line seem to provide a good model for the data? (d) What does the regression line predict as the winning pole vault height for the 2012 Olympics? Compare this predicted value to the actual 2012 winning height of 5.97 m, as described on page 177. Has this new regression line provided a better prediction than the line in Example 2?Q4. Using the listed duration and interval after times, find the best predicted “interval after”time for an eruption with a duration of 253 seconds. How does it compare to an actual eruptionwith a duration of 253 seconds and an interval after time of 83 minutes?Duration 242 255 227 251 262 207 140IntervalAfter91 81 91 92 102 94 91 a) Find the value of the linear correlation coefficient ?b) Find the critical values of r from table A-6 using ∝= 0.05c) Determine whether there is sufficient evidence to support a claim of a linear correlationBetween the two variables.Q4. Using the listed duration and interval after times, find the best predicted “interval after”time for an eruption with a duration of 253 seconds. How does it compare to an actual eruptionwith a duration of 253 seconds and an interval after time of 83 minutes?Duration 242 255 227 251 262 207 140IntervalAfter91 81 91 92 102 94 91 a) Find the value of the linear correlation coefficient ?b) Find the critical values of r from table A-6 using ∝= 0.05c) Determine whether there is sufficient evidence to support a claim of a linear correlationBetween the two variables.d) Find the regression equation,e) Letting the first variable be the predictor (x) variable, find the indicated predicted value.
- An emergency service wishes to see whether a relationship exists between the outside temperature and the number of emergency calls it receives for a 7-hour period. The data are shown. Temperature x No. of calls y 68 74 7 4 8 82 88 10 93 11 99 9 Test the significance of the correlation coefficient at alpha = 0.05 13 101 f = Step 1: State the hypotheses. Step 2: Find the critical values. Step 3. Compute the test value. Step 4. Make the decision. Step 5. Summarize the results.The scale of the correlation coefficient is: a. nominal b. ordinal c. ratioFor the data given in the table below, find the linear correlation coefficient r and the least-squares regression line x y ------- 1 18 3 13 3 9 6 6 7 4 -------
- Here is a bivariate data set. x y -1 78 -27 214 39 -43 19 -3 -9 88 -3 66 25 64 Find the correlation coefficient and report it accurate to four decimal places.r = A good correlation calculator is found at Correlation CalculatorQQ3. Diamond PricesWeight 0.3 0.4 0.5 0.5 1.0 0.7Price 510 1151 1343 1410 5669 2277Find the best predicted price for this diamond with a weight of 1.50 carats. Is the result close tothe actual price of $16,097? What is wrong with predicting the price of a 1.50-carat diamond? a) Find the value of the linear correlation coefficient ?b) Find the critical values of r from table A-6 using ∝= 0.05c) Determine whether there is sufficient evidence to support a claim of a linear correlationBetween the two variables.The grades of a class of 9 students on a midterm report (x) and on the final examination (y) are as follows: Give the following: a. linear regression line and equation b. computation of the coefficient of determination ?^2 c. Computation of the coefficient of correlation ? d. Estimate the final examination grade of a student who received a grade of 85 on the midterm report.
