Given the bivariate data: 3 5 7 5 3 2 1 a. Draw a scatter diagram for the data. b. Find n,,, and . c. Find a, the slope of the least-square line, and b, the y-intercept of the least-square line.
Given the bivariate data: 3 5 7 5 3 2 1 a. Draw a scatter diagram for the data. b. Find n,,, and . c. Find a, the slope of the least-square line, and b, the y-intercept of the least-square line.

Big Ideas Math A Bridge To Success Algebra 1: Student Edition 2015
1st Edition
ISBN:9781680331141
Author:HOUGHTON MIFFLIN HARCOURT
Publisher:HOUGHTON MIFFLIN HARCOURT
Chapter11: Data Analysis And Displays
Section11.2: Box-and-whisker Plots
Problem 6E

Related questions
Question
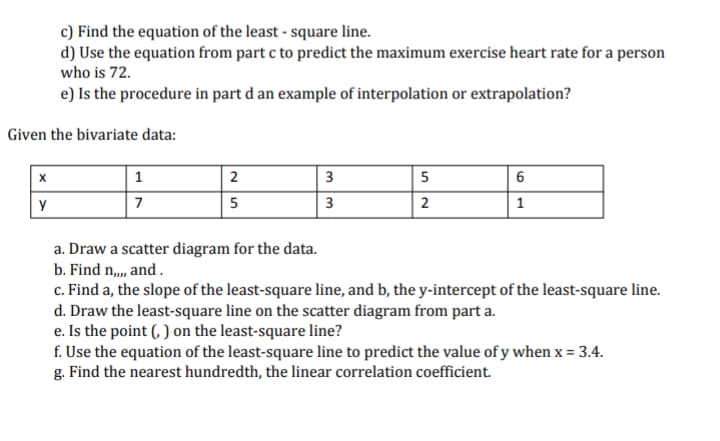
Transcribed Image Text:c) Find the equation of the least - square line.
d) Use the equation from part c to predict the maximum exercise heart rate for a person
who is 72.
e) Is the procedure in part d an example of interpolation or extrapolation?
Given the bivariate data:
2
3
5
y
7
5
3
2
1
a. Draw a scatter diagram for the data.
b. Find n,, and.
c. Find a, the slope of the least-square line, and b, the y-intercept of the least-square line.
d. Draw the least-square line on the scatter diagram from part a.
e. Is the point (, ) on the least-square line?
f. Use the equation of the least-square line to predict the value of y when x = 3.4.
g. Find the nearest hundredth, the linear correlation coefficient.
Expert Solution
This question has been solved!
Explore an expertly crafted, step-by-step solution for a thorough understanding of key concepts.

Step by step
Solved in 4 steps with 2 images

Recommended textbooks for you
Big Ideas Math A Bridge To Success Algebra 1: Stu…
Algebra
ISBN:
9781680331141
Author:
HOUGHTON MIFFLIN HARCOURT
Publisher:
Houghton Mifflin Harcourt

Glencoe Algebra 1, Student Edition, 9780079039897…
Algebra
ISBN:
9780079039897
Author:
Carter
Publisher:
McGraw Hill
Big Ideas Math A Bridge To Success Algebra 1: Stu…
Algebra
ISBN:
9781680331141
Author:
HOUGHTON MIFFLIN HARCOURT
Publisher:
Houghton Mifflin Harcourt
Glencoe Algebra 1, Student Edition, 9780079039897…
Algebra
ISBN:
9780079039897
Author:
Carter
Publisher:
McGraw Hill