Given the bivariate data: X12356 65431 (a) Draw a scatter diagram for the data A - Xy IN² 4 . . -10 " . (2x)² - Ixy () Find a, the slope of the least squares line, and b WebAssign Graphing Tool (6) Draw the least-squares line on the scatter diagram from part (a). Graph Layers After you add an object to the graph you can use Graph Layers to view and edit properties -intercept of the least-squares line. (Round your answers to two decimal places)
Given the bivariate data: X12356 65431 (a) Draw a scatter diagram for the data A - Xy IN² 4 . . -10 " . (2x)² - Ixy () Find a, the slope of the least squares line, and b WebAssign Graphing Tool (6) Draw the least-squares line on the scatter diagram from part (a). Graph Layers After you add an object to the graph you can use Graph Layers to view and edit properties -intercept of the least-squares line. (Round your answers to two decimal places)

Linear Algebra: A Modern Introduction
4th Edition
ISBN:9781285463247
Author:David Poole
Publisher:David Poole
Chapter7: Distance And Approximation
Section7.3: Least Squares Approximation
Problem 29EQ

Related questions
Question
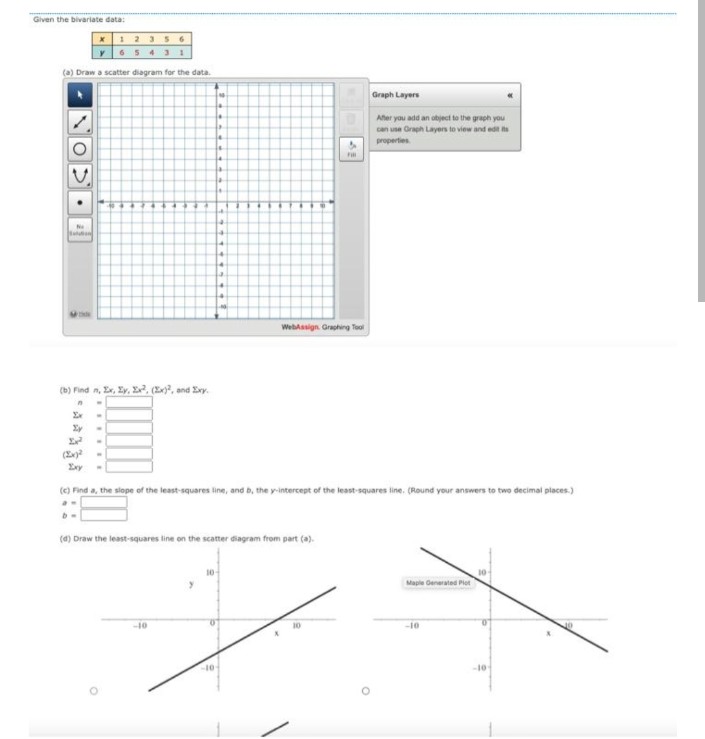
Transcribed Image Text:Given the bivariate data:
12356
65431
(a) Draw a scatter diagram for the data.
O >
• ²
(b) Find n, x, y, x², (Ex)², and Exy.
n
-
Ex
Xy
(2x)²
-
-
-
4
-10
18
A
-10
*
(c) Find a, the slope of the least-squares line, and b, the y-intercept of the least-squares line. (Round your answers to two decimal places.)
(d) Draw the least-squares line on the scatter diagram from part (a).
WebAssign Graphing Tool
10-
Graph Layers
After you add an object to the graph you
can use Graph Layers to view and edit t
properties
Maple Generated Piot
-10
-10
10
Transcribed Image Text:O
-10-
-10-
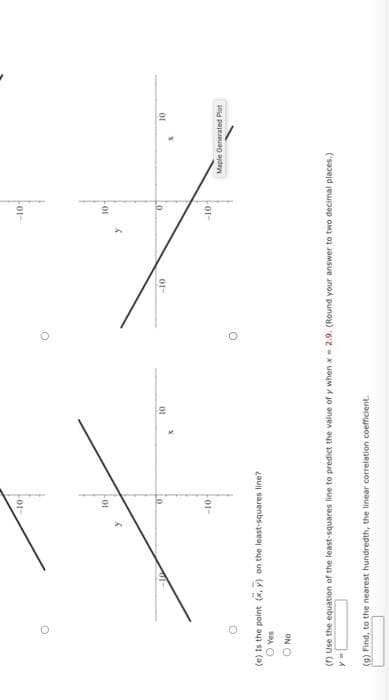
(e) Is the point (x, y) on the least-squares line?
Ⓒ Yes
O No
X
10
-10
(9) Find, to the nearest hundredth, the linear correlation coefficient.
10-
-10-
(f) Use the equation of the least-squares line to predict the value of y when x 2.9. (Round your answer to two decimal places.)
10
Maple Generated Plot
Expert Solution
This question has been solved!
Explore an expertly crafted, step-by-step solution for a thorough understanding of key concepts.

Step by step
Solved in 4 steps with 6 images

Recommended textbooks for you
Linear Algebra: A Modern Introduction
Algebra
ISBN:
9781285463247
Author:
David Poole
Publisher:
Cengage Learning

Elementary Linear Algebra (MindTap Course List)
Algebra
ISBN:
9781305658004
Author:
Ron Larson
Publisher:
Cengage Learning
Linear Algebra: A Modern Introduction
Algebra
ISBN:
9781285463247
Author:
David Poole
Publisher:
Cengage Learning
Elementary Linear Algebra (MindTap Course List)
Algebra
ISBN:
9781305658004
Author:
Ron Larson
Publisher:
Cengage Learning