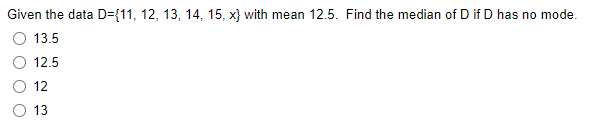
Given the data D={11, 12, 13, 14, 15, x} with mean 12.5. Find the median of D if D has no mode. O 13.5 12.5 O 12 O 13


Q: The mean of the following data values is 36. 19, 23, 35, 41, 42 A. True O B. False
A: Measure of central tendency measures the central or average value of a dataset. Measured of…
Q: A sample of college students was asked how much they spent monthly on pizza. Approximate the mean…
A:
Q: Consider the following data consisting of 9 values: Data 19 16 7 10 17 20 The minimum is The first…
A:
Q: In a survey, 20 people were asked how many magazines they had purchased during the previous year.…
A: Median and mode are the types of average. This is descriptive statistics. Median and mode are the…
Q: Assuming the following frequency table of a sample of student marks: Mark 1-15 16-24 25-35 36-50…
A: Here there since you have posted multiple questions and as per the guidelines we can answer the…
Q: a sample of 30 3-5 year old children were asked to count out loud. The highest number of numbers…
A: Since you have posted a question with multiple sub-parts, we will solve the first three subparts for…
Q: The following C.I.s were obtained for the mean of the same populat [16, 23] and [18, 25]. Identify…
A: From the given information, The C.I for the mean are 16, 23 and 18, 25. Consider, [16, 23].…
Q: Q. 8. Calculate the mean from the following data: Marks below : 10 20 30 40 50 No. of students : 15…
A:
Q: If n=185, x=5.82, s= 2.16. Is the claim correct that the mean is less than 6.00 with a significance…
A: n=185 , x=5.82 , s=2.16 Null Hypothesis : Statement with no significant difference in the…
Q: Given the following data: 14, 13, 9, 12, 5, 15, 17, and 16. Identify the median O 5 O 5 O 10.5 O…
A:
Q: Find the median from the following table : Marks No. of students Marks No. of students 0-10 2 40-50…
A:
Q: The following information was obtained from the records of a factory relating to the wages.…
A:
Q: For which of the following distributions is the mean greater than the median? (A) (B) (C) (D) (E)
A: The mean and median are usually same for symmetric distribution.
Q: Calculate mean median, mode and G.M from following data Davly 11-13 13-15 1517 17-19 19-2) 10 13 6 4
A: Given data is appropriate for measures of central tendency
Q: According to a college survey, 22% of all students work full time. Find the mean for the number of…
A: Given information: Percentage of students that work full time = 22% The probability of success, that…
Q: Given the interval estimate for the mean (6.2, 17.6), the point estimate for the mean is
A: Solution: From the given information, the interval estimate for the mean is (6.2, 17.6).
Q: Compute the median given the following data: SCORES IN (1) (f) STATISTICS 75 – 79 70 – 74 7 65 – 69…
A: Consider the following table-
Q: 8. For a moderately skewed data, the arithmetic mean is 200, the coefficient of vatiation is 8 and…
A: Solution: 8. From the given information, arithmetic mean is 200, the coefficient of variation is 8…
Q: A sample of scores has a mean of ? = 35 and ? = 6. Find the z-scores that correspond to the…
A: We have given that, Let Y be the random variable from normal distribution with mean (μ) = 35 and…
Q: 1. Based on the data, what is the mean nominal wage? A. 123.26 B. 291.81 C. 350.00 D. 358.88 2.…
A: Part (1) The nominal wages are: 537, 350, 340, 360, 400, 400, 320, 310, 395, 386, 315, 316, 365,…
Q: A: The following data shows the weights of a sample of children measured to the nearest kilogram a…
A: Hi! Thank you for the question As per the honor code, We’ll answer the first question since the…
Q: 2. The following is the distribution of the percentage of students belonging to a certain minority…
A: A measure of central tendency is a single value that attempts to describe a set of data by…
Q: 20. Find the mode, median, and mean, respectively, of the data given in the stem and leaf plot…
A:
Q: A population of scores has a mean of ? = 35 and ? = 3.5. Find the z-scores that correspond to the…
A: Solution- Given that mean mu=35 and standard deviation s=3.5 Find Z score for corresponding X values…
Q: The following data represent the weights (in grams) of a simple random sample of a candy. 0.89 0.86…
A: The frequency for each class interval is obtained by counting the number of data values that lie…
Q: Use the following frequency distribution table to determine how many subjects were in the study. Xf…
A: Given information- We have given the following frequency distribution table. x f 5 2 4 4 3…
Q: Consider the numbers 2 3 4 5 5 Compute the mode,median and mean
A: Given data : 2,3,4,5,5 Mean, x =Sum of all the numbersTotal no. of numbers Median, M = The middle…
Q: Find the mean, median, and mode of the data. Heights of Students in Class |||| || ||T 60 62 64 66 68…
A: From the given dot plot, the data values are 60, 64, 65, 65, 66, 67, 67, 67, 69, 69, 70, 72, 72, 74,…
Q: 11. What is the mean of this data? A. 0 B. 1 C. 2 D. 3 12. What is its median? (Same choices as in…
A: Given that : A data set { 0,0,1,4,5 } We use here mode concept to solve this.
Q: Find the mean, median, and mode for the following frequency distribution. f 3 9. 4 2 7 7 4 8 234 56
A: Solution
Q: 15) If the population mean u of the data set is 2.09, what is the mean g of the sampling…
A:
Q: A sample data set has a mean of 57 and a standard de- viation of 11. Determine whether each of the…
A: Given : A sample data set has a mean 57 and a standard deviation of 11 i,e Mean = 57 Standard…
Q: Médian of a data set The following list contains the number of hours that a sample of 8…
A: Median is the middle number found by ordering all data points and picking out the one in the middle…
Q: Suppose a distribution has Mean=20, Median=10, and SD=15. Then, the coefficient of skewness is, a)…
A: Given: Mean = 20 Median =10 SD = 15
Q: A 10-item statistics quiz was given to 30 students. The What was the median score on the quiz? table…
A: Median is half of score
Q: 4 Given that the approximate shape for the distribution of a data set is right-skewed (positive). If…
A: We have to find correct option.
Q: d) For the following data (80, 40, 62, 70, 30, 82), the standard deviation is 24 O 24.5 O 25 O 25.5…
A:
Q: It is believed that the height of the taller parent is related to the height of the tallest child.…
A:
Q: Find the median of the data using an empirical formula, when it is given that Mode= 35.3 and mean =…
A: Step 1Empirical formulaMode = 3 Median - 2 Mean
Q: Use the following data to answer the following questions: 101.4, 150.1, 134.8, 139.2, 125.7 1. The…
A:
Q: Find the median from the following data: Class Interval Frequency 5- 10 15 10 - 15 20 15-20 22 20…
A: We want to find median
Q: Below are the typing speeds (words per minute) for 22 secretarial applicants of an international…
A:
Q: Use the set of data in the box to answer the question. 1-3 100 123 100 121 139 100 119 117 125 136…
A: For the given data Find Mean =? mode =? median = ?
Q: A random sample of 15 college students were asked "How many hours per week typically do you work…
A:
Q: dent 5 4 Student 6 7 Student 7 7 Student 8 5 Student 9 1 Student 10 10 Student 11 8…
A: Given that ; Sample size (n) = 15 Let X represents the scores on Dr. Grant’s Professional…
Q: 2. The following is the distribution of the percentage of students belonging to a certain minority…
A: We have given that The percentage of students belonging to a certain minority group in 40 school…
Q: Find the mean , the median, and the mode(s), if any, for the given data. Round noninteger means to…
A: Solution: The given data is –8.9, –2.4, 4.5, 4.5, 6.2, 8.5 and 9.1. Mean: Thus, the mean is 3.1.
Q: For which of the following is the mean greater than the median? A. В. С. D. E.
A: The mean is used to get overall idea about the data set. Mean is the ratio of the sum of all…
Q: The sample mean is the point estimator of O A. µ O B. p O C. X O D. o
A: Point estimator is the estimate of the population parameter.
Q: 9. What is the median value of the data in the stemplot? 024 Key: 23 means 23 33356 6799 11145 57…
A: In the given question it is asked to calculate the median of given data below. Also it is said that…

Step by step
Solved in 2 steps with 2 images
