Given the following information Assumed Total Sum of Squ. ares of devi- ations from Мean deviations from assumed mean the assumed mean Series 41 -170 8180 Series 32 -20 2290 y
Given the following information Assumed Total Sum of Squ. ares of devi- ations from Мean deviations from assumed mean the assumed mean Series 41 -170 8180 Series 32 -20 2290 y

Glencoe Algebra 1, Student Edition, 9780079039897, 0079039898, 2018
18th Edition
ISBN:9780079039897
Author:Carter
Publisher:Carter
Chapter10: Statistics
Section10.1: Measures Of Center
Problem 9PPS

Related questions
Question
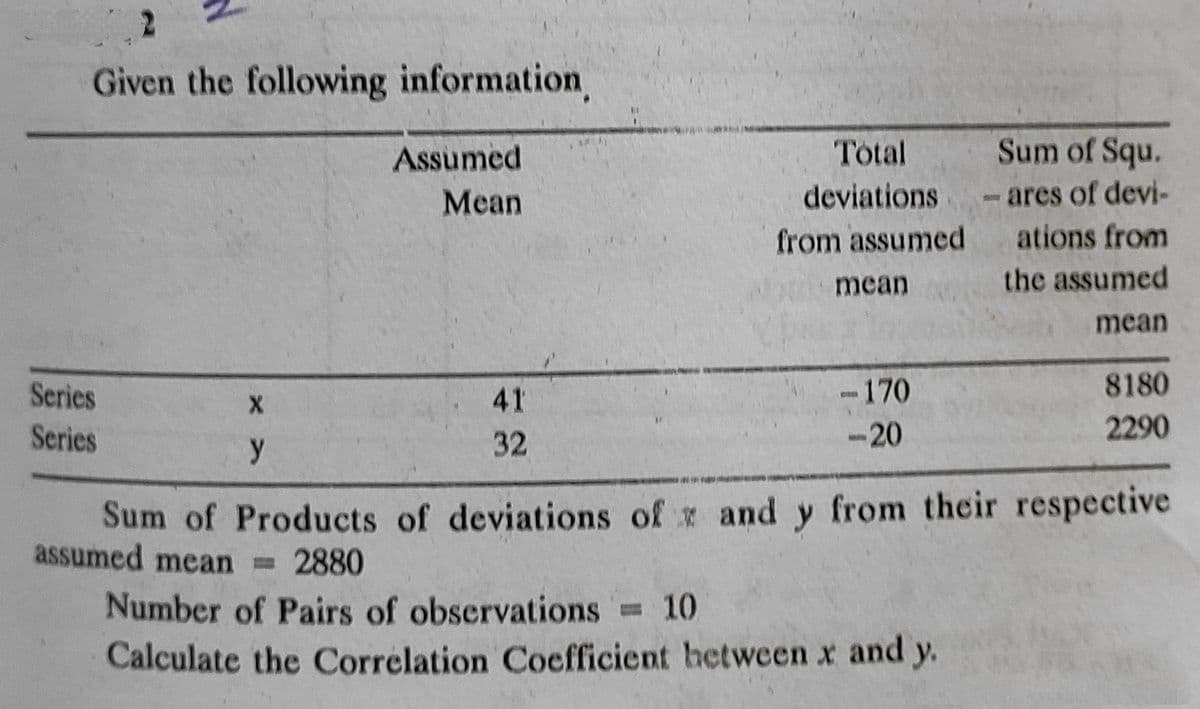
Transcribed Image Text:Given the following information
Assumed
Total
Sum of Squ.
-ares of devi-
ations from
Mean
deviations
from assumed
mean
the assumed
mean
Series
41
-170
8180
Series
32
-20
2290
y
Sum of Products of deviations of x and y from their respective
assumed mean 2880
Number of Pairs of observations 10
Calculate the Correlation Coefficient hetween x and y.
%3D
Expert Solution
This question has been solved!
Explore an expertly crafted, step-by-step solution for a thorough understanding of key concepts.

Step by step
Solved in 2 steps with 2 images

Recommended textbooks for you
Glencoe Algebra 1, Student Edition, 9780079039897…
Algebra
ISBN:
9780079039897
Author:
Carter
Publisher:
McGraw Hill
Glencoe Algebra 1, Student Edition, 9780079039897…
Algebra
ISBN:
9780079039897
Author:
Carter
Publisher:
McGraw Hill