Given the following table of values: y 1 10 2 8 5 4 Which of the following would be the correct equation for the regression line (or line of best fit)? Oŷ = -0.961lx + 9. 90 Oŷ = -1.46x + 11. 2 Oŷ = 2. 56x +0. 507 âŷ = –1. 32x + 10. 9
Given the following table of values: y 1 10 2 8 5 4 Which of the following would be the correct equation for the regression line (or line of best fit)? Oŷ = -0.961lx + 9. 90 Oŷ = -1.46x + 11. 2 Oŷ = 2. 56x +0. 507 âŷ = –1. 32x + 10. 9

Functions and Change: A Modeling Approach to College Algebra (MindTap Course List)
6th Edition
ISBN:9781337111348
Author:Bruce Crauder, Benny Evans, Alan Noell
Publisher:Bruce Crauder, Benny Evans, Alan Noell
Chapter3: Straight Lines And Linear Functions
Section3.4: Linear Regression
Problem 12SBE: Find the equation of the regression line for the following data set. x 1 2 3 y 0 3 4

Related questions
Question
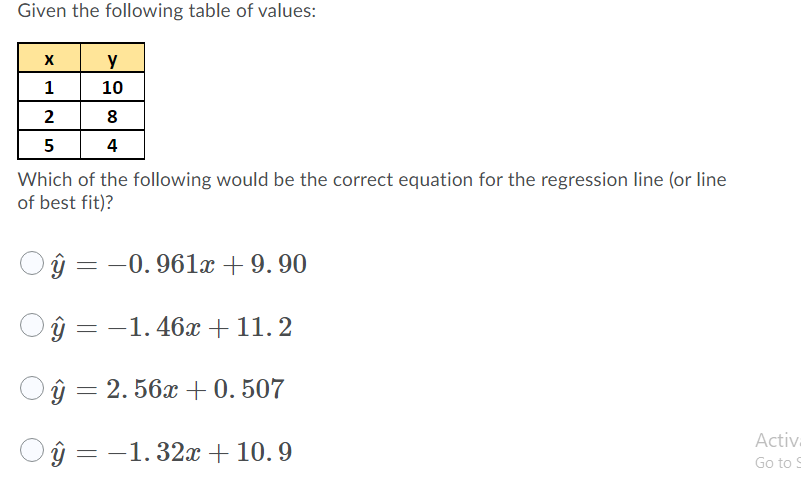
Transcribed Image Text:Given the following table of values:
y
1
10
2
8
5
4
Which of the following would be the correct equation for the regression line (or line
of best fit)?
ŷ = -0. 961x + 9. 90
ŷ = -1. 46x +11. 2
ŷ = 2. 56x +0. 507
Activa
ŷ = –1. 32x + 10. 9
Go to S
Expert Solution
This question has been solved!
Explore an expertly crafted, step-by-step solution for a thorough understanding of key concepts.

Step by step
Solved in 2 steps with 5 images

Follow-up Questions
Read through expert solutions to related follow-up questions below.
Follow-up Question

Transcribed Image Text:What is the value of the linear correlation coefficient "r" for the following table of values?
y
1
2
4
7
Solution
Recommended textbooks for you
Functions and Change: A Modeling Approach to Coll…
Algebra
ISBN:
9781337111348
Author:
Bruce Crauder, Benny Evans, Alan Noell
Publisher:
Cengage Learning
Functions and Change: A Modeling Approach to Coll…
Algebra
ISBN:
9781337111348
Author:
Bruce Crauder, Benny Evans, Alan Noell
Publisher:
Cengage Learning