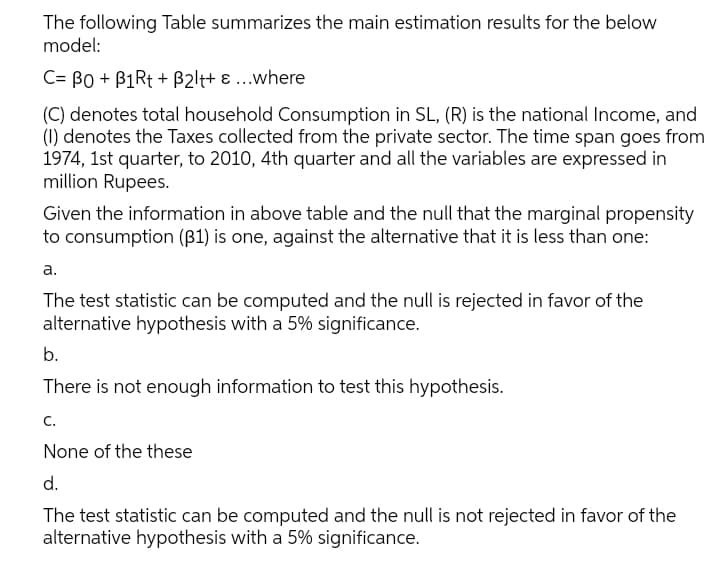
Given the information in above table and the null that the marginal propensity to consumption (B1) is one, against the alternative that it is less than one:


Q: 15.25
A:
Q: 2. Terms and logic of ANOVA Arachnophobia is the fear of spiders. People with arachnophobia suffer t...
A: An ANOVA test is conduct where three groups of arachnophobia peoples are exposed to vivo flooding, i...
Q: Among a group of 28 stocks, suppose that 14 will perform above average and the other 14 will perform...
A: Given that, Above average =14 Below average =14 Total = 28 P(all 9 above average ) = ?
Q: random sample of ten people, the mean driving distance to work was 23.2 miles and the standard devia...
A: Given Sample mean=x̄=23.2, s=7.4,n=10
Q: om's commuting time from his residence in Carmel to the IUPUI campus has a normal distribution. The...
A: Given that The Tom's commuting time from his residence in Carmel to the IUPUI campus has a normal d...
Q: The length of pregnancies are normally distributed with a mean of 266 days and a standard deviation ...
A: Ans#- Given, The length of pregnancies are normally distributed with a mean μ = 266 days ...
Q: A drug test correctly gives a positive result 94 percent of the time. However, 2 percent of the time...
A:
Q: 13. Plot your data as a histogram showing the frequency of extinction events. There is a tool provid...
A: "Since you have asked multiple question, we will solve the first questions for you. If you want any ...
Q: Q. 16. Calculate co-efficient of rank correlation from the following data. x = 15 12 14 13 8 7 5. 9....
A:
Q: A home pregnancy test was given to women, then pregnancy was verified through blood tests. The follo...
A:
Q: 3. Researchers Regine Dilla and associates wanted to determine whether consumption of cola is associ...
A: Introduction: It is required to explain the reason this is a cohort study, and to identify the expla...
Q: Question 2 Do running times of American movies differ somehow from running times of French movies? A...
A: Given that Am:94,90,95,93,128,95,125,91,104,116,162,102,90,110,92,113,116,90,97,103,95,120,109,91,1...
Q: Match the following definitions with the correct terms. Data involving a single variable [ Choose ] ...
A: Match the following:
Q: Write a word problem that can be solved with the equation 2 + 3 =?. Note: The order does matter. W...
A: The three linear equations have been given and objective is to write word problem to justify them.
Q: Problem 7-21 (Algo) Benny the Barber owns a one-chair shop. At barber college, they told Benny that ...
A:
Q: Lung cancer is the leading cause of cancer-related deaths in the United States. Researchers examined...
A: At first draw the tree diagram and then do....the conditional probability..
Q: 4: a) Let X.X., X -N (Hi,6f). Let Y,, Y2 Ym-N (u2,63). .... d (1-a) % CIfor oi when ai. a known.
A:
Q: Fresh Donuts! A donut company says that their donuts remain fresh for over 2 days on average. A donu...
A: Hypothesized Population Mean (\mu)(μ) = 22 Sample Standard Deviation (s)(s) = 0.80.8 Sample...
Q: Problem : In Dodge's CSP-1, it is desired to apply sampling inspection to 1 item out of every 15 ite...
A:
Q: Regions under the curve can be described in terms of area. True or False
A: We want to tell you above statement is true or false
Q: Calculate mode from following data: 5-10 10-20 20-30 30-40 40-50 50-60 60-70 X: 0-5 128 150 520 464 ...
A: Data given Class Frequency 0 - 5 128 5 - 10 150 10 - 15 520 15 - 20 464 20 - 25 398 ...
Q: 4. From the marks obtained by 8 students in Accountancy and Statistics, compute rank coefficient of ...
A:
Q: A check-cashing service has found that approximately 5% of all checks submitted to the service for c...
A: For testing the claim that if the considered true proportion (i.e., the proportion of bad check in t...
Q: x 27 42 31 47 23 40 34 52 y 32 19 26 13 29 17 21 14 given Σx = 296, Σy = 171, Σx...
A: For the given data Find x bar = ?y bar = ? ŷ = ? r2= ? explained= ? % unexplained= ? % Suppose a...
Q: Null: mu1 ≥ mu2; Alternative: mu1 mu2 Null: mu1 = mu2; Alternative: mu1 ≠ mu2 B. The value of the t...
A: sample of workers in Italy and the United States. United States Italy Average length...
Q: Good day, this problem is already reposted. Pls answer question 4 this time. Since it is related to ...
A: Given A random sample was taken of the thickness of insulation in transformer windings, and the foll...
Q: Manufacture of a certain component requires three different machining operations. Machining time for...
A: From the given information, H0:μ=65Ha:μ≠65 true average machine time is 66 minutes. sample size, n=1...
Q: Calculate mode from following data: 10-20 20-30 30-40 40-50 50-60 60-70 X : 0-5 5-10 f: 128 150 520 ...
A: Class Frequency 0 - 5 128 5 - 10 150 10 - 20 520 20 - 30 464 30 - 40 398 40 - 50 3...
Q: Sketch by hand a scatterplot of the number of uninsured people in 2007 (as the response variable) ag...
A:
Q: 6. The three samples below have been obtained from normal populations with equal variances. Test the...
A: To compare the population means of more than 2 groups the ANOVA F single factor test is used. This t...
Q: 14.18
A:
Q: Consider the following sample data. Sample A: 9, 15, 21 Sample B: 67, 73, 79 Sample C: 1,030; 1,0...
A: Formula : sample mean : x̄=Σx/n Standard deviation :
Q: Fresh Donuts! A donut company says that their donuts remain fresh for over 3 days on average. We tes...
A: From the provided information, Sample size (n) = 16 Level of significance (α) = 0.05
Q: Identify the lower class limits, upper class limits, Blood Platelet Count of class width, class midp...
A:
Q: Årea = 0.2810 The z-score is. (Round to two decimal places as needed.)
A:
Q: The density function for a random variable X is f(x). 2x 0 < x < 1 2 f (x) = { elsewhere P({0.4 < X ...
A: Ans#- Given, the probability density function of x is f(x) = 2 - 2x, 0<x<10otherwi...
Q: Q. 16. Calculate co-efficient of rank correlation from the following data. x= 15 12 14 13 7 5. 8 9. ...
A: X Rank(X) Y Rank(Y) 15 8 18 8 12 5 6 1 14 7 8 3 13 6 9 4 9 4 12 7 8 3 7 2 7 2 11 6 5...
Q: On an assembly line, there are 3 "checkpoints" at which a widget is inspected for defects. Upon revi...
A: Note: "Since you have posted a question with multiple sub -parts, we will solve first three sub part...
Q: Instruct. The random variable X represents the number of defective bulbs when 3 bulbs are tested. T...
A: It is given that the random variable X represents the number of defective bulbs when 3 bulbs are tes...
Q: derive the variance of standard normal distribution using the MGF; show complete solution.
A: Given: random variable x follow standard normal distribution then derive the variance of standard no...
Q: The random number generator program picks a number between 0 and 100 using a uniform distribution (w...
A: Introduction: Denote X as the random number obtained by the random number generator, between 0 and 1...
Q: An article regarding interracial dating and marriage recently appeared in a newspaper. Of the 1708 r...
A: Given: Asians = 253 Among Asians welcome a white person, Latino and black person. White Person = 79%...
Q: An oil company estimates that only 1 well in 17 will yield commercial quantities of oil. Assume that...
A:
Q: Suppose I flip a fair coin n = 20 times. A psychic tries to predict the outcome before each flip. Th...
A:
Q: Calculate mode from following data: 0-5 5-10 10-20 20-30 30-40 40-50 50-60 60-70 X: 128 150 520 464 ...
A:
Q: 2.17 Global warming: A research poll asked 1736 Americans "From what you've read and heard, is there...
A: From the given table Find ( d ) P ( earth is warming / conservative republican ) = ? ( e ) Whether e...
Q: 2. Elizon Pharmaceuticals, Inc., announced the results of its first human trial of NPI 32101, a topi...
A: Experimental design Experimental design is a concept used to organize, conduct, and interpre...
Q: 9. From the data given below examine whether there exists any correlation between X and Y: X: 6.9 8....
A:
Q: Consider the following Information: Rate of Return if State Ocgura State of Probability of Xconony S...
A: Given data
Q: Choose the right answer for the following:
A: Spatial data is location-specific data and non-spatial data doesn't involve locations.
Please the correct answer

Step by step
Solved in 3 steps

- A data with 18 points will be integrated as accurately as possible using a combination of Simpson's rules. It will require ____ applications of Simpson's 3/8th rule and _____ applications of Simpson's 1/3rd ruleA tax accountant would like to test the claim that the proportion of individuals who owe when filing their taxes is less than 0.20. If the z− test statistic was calculated as z=−2.11, does the tax accountant have enough evidence to reject the null hypothesis? Assume α=0.005. Move the blue dot to choose the appropriate test (left-, right, or two-tailed). Then, use the graph below to show the test statistic, p-value, and the rejection region to make a conclusion about the hypothesis test. powered by Move the blue dot to choose the appropriate test α=0.01 α=0.025 α=0.05 α=0.1 Significance level = 0.01 Select the correct answer below: There is enough evidence to suggest the proportion of individuals who owe when filing their taxes is less than 0.20. There is not enough evidence to suggest the proportion of individuals who owe when filing their taxes is less than 0.20. There is enough evidence to suggest the proportion of individuals who owe when filing their taxes is greater than 0.20.…Table 1 shows the total amount spent in Malaysia by tourists from Saudi Arabia and Japan from 2010 to 2019. Based on Table 1, at the 0.01 level of significance, can we conclude that tourists from Saudi Arabia spent less than those from Japan. Table 1: Amount spend by tourists from Saudi Arabia and Japan Year Saudi Arabia Jepun 2010 0.7 1.1 2011 0.7 1.1 2012 0.8 1.4 2013 0.8 1.5 2014 1.1 1.8 2015 1.0 1.6 2016 1.3 1.3 2017 1.2 1.2 2018 1.3 1.7 2019 1.4 2.3
- over several weeks of normal, or in-control, operation, 20 samples of 150 packageseach of synthetic-gut tennis strings were tested for breaking strength. A total of 141packages of the 3000 tested failed to conform to the manufacturer’s specifications.a. what is an estimate of the process proportion defective when the system is in control?b. Compute the upper and lower control limits for a p chart.c. with the results of part (b), what conclusion should be made about the process if testson a new sample of 150 packages find 12 defective? Do there appear to be assignablecauses in this situation?d. Compute the upper and lower control limits for an np chart.e. Answer part (c) using the results of part (d).f. which control chart would be preferred in this situation? Explain.over several weeks of normal, or in-control, operation, 20 samples of 150 packageseach of synthetic-gut tennis strings were tested for breaking strength. A total of 141packages of the 3000 tested failed to conform to the manufacturer’s specifications.a. what is an estimate of the process proportion defective when the system is in control?b. Compute the upper and lower control limits for a p chart.c. with the results of part (b), what conclusion should be made about the process if testson a new sample of 150 packages find 12 defective? Do there appear to be assignablecauses in this situation?A production supervisor at a major chemical company wishes to determine whether a new catalyst, catalyst XA-100, increases the mean hourly yield of a chemical process beyond the current mean hourly yield, which is known to be roughly equal to, but no more than, 750 pounds per hour. To test the new catalyst, five trial runs using catalyst XA-100 are made. Assuming that all factors affecting yields of the process have been held as constant as possible during the test runs, it is reasonable to regard the five yields obtained using the new catalyst as a random sample from the population of all possible yields that would be obtained by using the new catalyst. Furthermore, we will assume that this population is approximately normally distributed. Regard the sample of 5 trial runs for which s = 19.00 as a preliminary sample. Determine the number of trial runs of the chemical process needed to make us: (Round up your answers to the next whole number.) (a) 95 percent confident that x¯ , the…
- The president of the American Insurance Institute wants to compare the yearly costs of auto insurance offered by two leading companies. He selects a sample of 15 families, some with only a single insured driver, others with several teenage drivers, and pays each family a stipend to contact the two companies and ask for a price quote. To make the data comparable, certain features, such as the deductible amount and limits of liability, are standardized. The data for the sample of families and their two insurance quotes are reported below. At the 0.10 significance level, can we conclude that there is a difference in the amounts quoted? Hint: For the calculations, assume the "Midstates Car Insurance" as the first sample. Midstates Car Gecko Mutual Family Insurance Insurance Becker $ 2,090 $ 1,610 Berry 1,683 1,247 Cobb 1,402 2,327 Debuck 1,830 1,367 DuBrul 930 1,461 Eckroate 697 1,789 German 1,741…According to the National Health and Nutrition Examination Survey (NHANES) sponsored by the U.S. government, a random sample of 712 males between 20 and 29 years of age and a random sample of 1,001 males over the age of 75 were chosen and the weight of each of the males were recorded (in kg). Do the data provide evidence that the younger male population weighs more (on average) than the older male population? Use “Y” for ages 20-29 and “S” for ages 75+. It was found that x̅Y=83.4, sY=18.7, x̅S=78.5, and sS=19.0. a)Suppose the test statistic is t = 2.398. What is the associated p-value? Group of answer choices 0.001 < p-value < 0.002 0.005 < p-value < 0.01 0.01 < p-value < 0.02 0.0005 < p-value < 0.001 b) Suppose the p-value is 0.02 < p-value < 0.04. At α = 0.10 what is the appropriate conclusion to make? Group of answer choices Fail to reject H0 and conclude that the mean weight of all males ages 20-29 is greater than the mean weight of all…According to the National Health and Nutrition Examination Survey (NHANES) sponsored by the U.S. government, a random sample of 712 males between 20 and 29 years of age and a random sample of 1,001 males over the age of 75 were chosen and the weight of each of the males were recorded (in kg). Do the data provide evidence that the younger male population weighs more (on average) than the older male population? Use “Y” for ages 20-29 and “S” for ages 75+. It was found that x̅Y=83.4, sY=18.7, x̅S=78.5, and sS=19.0. A) What are the correct null and alternative hypotheses? B)What is the parameter of interest? The difference between the mean weight of all males ages 20-29 and the mean weight of all males ages 75+ The mean weight (in kg) The difference between the mean weight of the sample of males ages 20-29 and the mean weight of the sample of males ages 75+ The mean difference between the weights of males ages 20-29 and males ages 75+ c)Is the randomness condition met for…
- An employee survey conducted two years ago by a company found that 46% of its employees were concerned about future health care benefits. A random sample of 84 of these employees were asked if they were now concerned about future health care benefits. Assuming that there has been no change in the level of concern about health care benefits compared to the survey two years ago, what is the upper limit of the sample proportion such that only 3% of the time the sample proportion would exceed this value?Consider again the salesperson discussed in previous Problems (given in picture) who is trying to locate a particular product. Calculate the variance and standard deviation of the number of warehouses called by the salesperson.To the Internal Revenue Service (IRS), the reasonableness of total itemized deductions depends on the taxpayer’s adjusted gross income. Large deductions, which include charity and medical deductions, are more reasonable for taxpayers with large adjusted gross incomes. If a taxpayer claims larger than average itemized deductions for a given level of income, the chances of an IRS audit are increased. Data (in thousands of dollars) on Adjusted Gross Income (AGI) and the Reasonable Amount of Itemized Deductions (RAID) are as follows: AGI : 22, 27, 32, 48, 65, 85, 120 RAID : 9.6, 9.6, 10.1, 11.1, 13.5, 17.7, 25.5 The correct interpretation of the meaning of each of the coefficients in the linear model is: a. When AGI is zero, the RAID is $4680 in this linear model. Since x = 0 is not included in the sample values of the independent variable, this interpretation cannot be a meaningful one. For every one thousand dollar of the AGI, the RAID increases by $161 in this linear model.…
