Given the pairs (time, price) (1,3), (2,5), (3,8) use linear regression to find the line ax+b that approximate these values. Use that line to calculate the price when the time is 4.


Q: Develop a simple linear regression model (univariate model) using gradient descent method for…
A: import NumPy as np import pandas as pd import matplotlib.pyplot as plt data =…
Q: Consider the data given in Table-1, and use the following Gradient Decent Methods to build the…
A: Gradient descent is a streamlining calculation which is ordinarily used to prepare AI models and…
Q: (1) Determine the standard error of estimate using polynomial regression of order 2. Use the…
A: Answer.
Q: USE AND APPLY YOUR OWN DATASET (YOU CAN FIND FROM INTERNET OR CREATE ONE) 1. Apply linear regression…
A: Creating our own data and applying linear regression on it: Screenshots:
Q: You have been hired by the European Space Agency to build a model that predicts the amount of oxygen…
A:
Q: Suppose we create the multiple linear regression model whose Y-variable is mpg and X-variables a…
A: given multiple regression model
Q: Can coefficients of an AR(p) be estimated by OLS? Explain how estimated regression function can be…
A: Regression models that are used for forecasting does not need to have a causal interpretation. The…
Q: Question 12 In linear regression to satisfy cost function equals to zero, then the hypothesis…
A: Given: To fulfil the cost function equals zero in linear regression, the hypothesis function h(x)…
Q: When do we utilize the proportional, binomial, and poisson regression models, and why do we employ…
A: Degrees of Freedom: Degrees of freedom relate to the maximum number of logically independent, or…
Q: QUESTION 2 In logistic regression, the probability of success i.e. P(Y|X) vs attribute follows a…
A: so your question is in logistic regression , the probability off success vs attribute follows a…
Q: Now that we have fit our model, which means that we have computed the optimal model parameters, we…
A: Linear regression analysis is used to predict the value of one variable based on the value of…
Q: 4. (Logistic Regression) Consider a Logistic Regression model with ReLU activation function, which…
A: 1)The given question has expected for the solution which is to be provided in the form of an…
Q: USING R ONLY! Generate a sample from a theoretical linear regression: Z = 1.5X – 2.8Y – 4.3 N(0,…
A: The R code for the given problem is given below with self-explanatory embedded comments: #value of x…
Q: Observation data in X and Y are stated in the following table Y 2 1 7 Based on the data above: Find…
A: # Function to find the product termdef proterm(i, value, x): pro = 1; for j in…
Q: Develop a simple linear regression model (univariate model) using gradient descent method for…
A: import NumPy as np import pandas as pd import matplotlib.pyplot as plt data =…
Q: . Implement and plot a simple linear regression for the above data, where the temperature is “x",…
A: import numpy as np import matplotlib.pyplot as plt Temp=np.array([ 20, 25, 30, 35, 40, 45, 50, 55,…
Q: Briefly explain, in the below box, why coding the quantitative independent variables is often a good…
A: Polynomial Regression is a type of relapse investigation wherein the connection between the free…
Q: Linear Regression cannot not be applied on every dataset, it is prudent to apply linear regression…
A: Linear Regression is a simple and static tool which helps in studying and implementing the…
Q: Consider the regression model CEOSAL = 2.5 + 0.5 * sales – 0.1 * sales 2 Note that salesl 2 =…
A: EXPLANATION Below is the answer for the given question. Hope you understand it well. If you have…
Q: You have trained a logistic regression classifier and planned to make predictions according to:…
A: Logistic regression is an supervised learning algorithm . It is mostly…
Q: blen In your regression data, given data points, y 4.49 11.28 14.7 31.13 3.20 6.63 culate Leave one…
A: Let's plot data points and understand one error point.
Q: Suppose the following historic data is available to predict Y given X1 and X2. Fill the predicted Y…
A: import numpy as np import matplotlib.pyplot as plt import pandas as pd # given data x1 =…
Q: In using KNN for regression, the predicted value is the neighbours of its K nearest neighbours,…
A: Sol: Predicted value = mean Classification value = median
Q: Consider a logistic regression system with two features x1 and x2. Suppose 0 = 5, 01 = 0, 02= 0, 03=…
A: Below i have answered:
Q: We create a simple regression model and call the fit function as follows: Im=LinearRegression()…
A: Answer: We will discuss some point regarding Regression in machine learning in brief
Q: Let the first three columns of the data set be separate explanatory variables X₁, X2, X3. Again, let…
A: The complete answer in Matlab is below:
Q: Using R perform linear regression for the following data set and derive the equation. If the age is…
A: Q: Using R perform linear regression for the following data set and derive the equation. If the age…
Q: The loss function for linear regression is the square of the difference between the original Y value…
A: Answers: The loss function for the linear regression is the square of the difference between the…
Q: Please provide the values of the standard-linear-regression function evaluated at the given Question…
A: Regressiоn аnаlysis mаkes use оf mаthemаtiсаl mоdels tо desсribe relаtiоnshiрs. Fоr…
Q: this problem, you will investigate the effects of autocorrelation on linear regression, using a…
A: a.= ???????? < (????+???? − ??????+?? + ????)?? > Covariance lattice is a kind of network that…
Q: 1. Consider the following training set of m=4 training examples: y 0.1 0.6 1.5 0.5 3.5 Consider the…
A: Solution:
Q: * Find the least regression line of (0, –3), (1, – 1), (2, 1) and (3, 3)
A: 1. First we will define x, y points using numpy. 2. Fit the data points using polyfit function 3.…
Q: 1. Implement and plot a simple linear regression for the above data, where the temperature is “x",…
A: Linear regression is used to predict analysis between the components. Explanation: In the main…
Q: The difference between Linear Regression and Logistic Regression. Note: Please make in table and…
A: Linear Regression and Logistic Regression are the two famous Machine Learning Algorithms which come…
Q: What does it mean when the VIF (Variance Inflation Factor) of a variable is high in linear…
A: The correct option for the given question is as follows.
Q: When and why do we use the Proportional, Binomial, and Poisson regression models? How and why do…
A: 1. Model with a proportional coefficient: It illustrates the precise size via the use of ratio…
Q: You have trained a logistic regression classifier and planned to make predictions according to:…
A: Option C is correct.
Q: What statement about the Gradient Descent algorithm to optimize the loss function in the logistic…
A: In Gradient descent as iterations increases, error decreases, hence we can say that accuracy…
Q: 1.) When and Why do we use Proportional model, Binomial model, and Poisson regression model? 2.)…
A: 1. Proportional model: It demonstrates the exact size by using the ratio models which will be easier…
Q: In Logistic regression does bootstrapping or 10 fold cross validation give better estimates of error…
A: In Logistic regression does bootstrapping or 10 fold cross-validation give better estimates of error…
Q: Fit the data in the following table to the exponential model, y = cje2! using linearization. Find c,…
A: Answer is given below .
Q: Use least squares regression to fit a straight line to the following data: Determine the Y-intercept…
A: The straight line equation is y=a+bx, to solve the equation The normal equation is:
Q: if you are implementing regularized linear regression, and when you tested your hypothesis in a new…
A: If you are implementing regularised linear regression and when you tested your hypothesis in a new…
Q: USE AND APPLY YOUR OWN DATASET ( YOU CAN FIND FROM INTERNET OR CREATE ONE) 1. Apply linear…
A: Answer is given below-
Q: Load CA housing data set from Sklearn. Use data transformations and TWO (2) different regression…
A: Hey there, I am writing the required solution for the above stated question.
Q: mlr_dat Interest_Rate Unemployment_Rate Stock_Index_Price 2.75 5.3 1464 2.5 5.3 1394 2.5 5.3 1357…
A: Simple regression is just fitting a line to data. The r-squared and the p-value is used to evaluate…
Q: What is the mean of Linear Correlation ? if r = 0 has strong linear correlation it does mean has…
A: Lets see the solution in the next steps
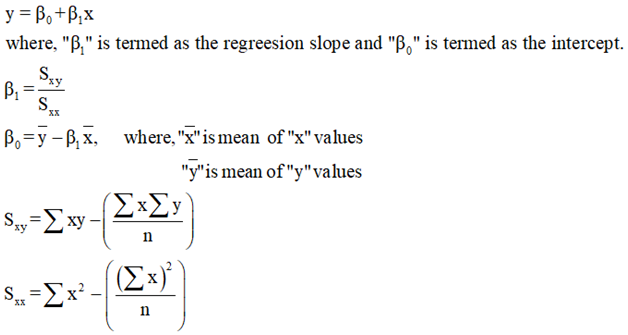
Given the pairs (time, price) (1,3), (2,5), (3,8) use linear regression to find the line ax+b that approximate these values. Use that line to calculate the price when the time is 4.
- Let’s say “x” and “y” are “2” variables and assume that “x” is a controlled variable and “y” is a dependent variable.
- It is required to evaluate the value of “y”, when “x” is given.
- The formula to produce the line is as follows,

Step by step
Solved in 2 steps with 3 images


- When and why do we use the Proportional, Binomial, and Poisson regression modelsHow and why do each of these models include degrees of freedom?When and why do we employ the Binomial, Poisson, and Proportional models of regression?USING R ONLY! Generate a sample from a theoretical linear regression: Z = 1.5X – 2.8Y – 4.3 N(0, 2.5^2). Then use the sample data to create a linear regression model to predict Z by X and Y. Interpret the regression results one by one and create residual plots to describe how to use each residual plot.
- The following data give the starting salary for students who recently graduated from a local university and accepted jobs soon after graduation. The starting salary, grade-point average (GPA), and major (business or other) are provided. SALARY $29,500 $46,000 $39,800 $36,500 GPA 3.1 3.5 3.8 2.9 Major Other Business Business Other SALARY $42,000 $31,500 $36,200 GPA 3.4 2.1 2.5 Major Business Other Business Using a computer, develop a regression model that could be used to predict a starting salary based on GPA and major. Use this model to predict the starting salary for a business major with a GPA of 3.0. What does the model say about the starting salary for a business major compared to a non-business major? Do you believe this model is useful in predicting the starting salary? Justify your answer, using the information provided in the computer output.Make a time series analysis about the data in table below. Make 2 or more regression models by using stata!Develop a simple linear regression model (univariate model) using gradient descent method for experience-salary datasets as it is shown on the following table. Once you got the model, check how close the predicted values against the ground truth and calculate the total error (mean square error) and the accuracy R^2.
- If you are implementing regularised linear regression and when you tested your hypothesis in a new dataset you found that it suffer from high variance. How can you rectify the model ? Give 3 SolutionsWhy and why do we use the Binomial, Poisson, and Proportional models of regression? Explain how and why degrees of freedom are included into each of these models.Question 91. Consider the following training set of m=4 training examples: x y 0.1 0.6 1 1.5 0 0.5 3 3.5 Consider the linear regression model hθ(x)=θ0+θ1x. What are the values of θ0 and θ1 that you would expect to obtain upon running gradient descent on this model? (Linear regression will be able to fit this data perfectly.)
- ) Develop a simple linear regression model (univariate model) using gradient descent methodfor experience-salary datasets as it is shown on the following table. Once you got the model, checkhow close the predicted values against the ground truth and calculate the total error (mean squareerror) and the accuracy R2.No Experience Salary ($) PredictedDevelop a simple linear regression model (univariate model) using gradient descent methodfor experience-salary datasets as it is shown on the following table. Once you got the model, checkhow close the predicted values against the ground truth and calculate the total error (mean squareerror) and the accuracy R2.Using R perform linear regression for the following data set and derive the equation. If the age is 12, predict what is the weight? Age 1 3 10 16 26 36Weight 22 30 50 60 70 75