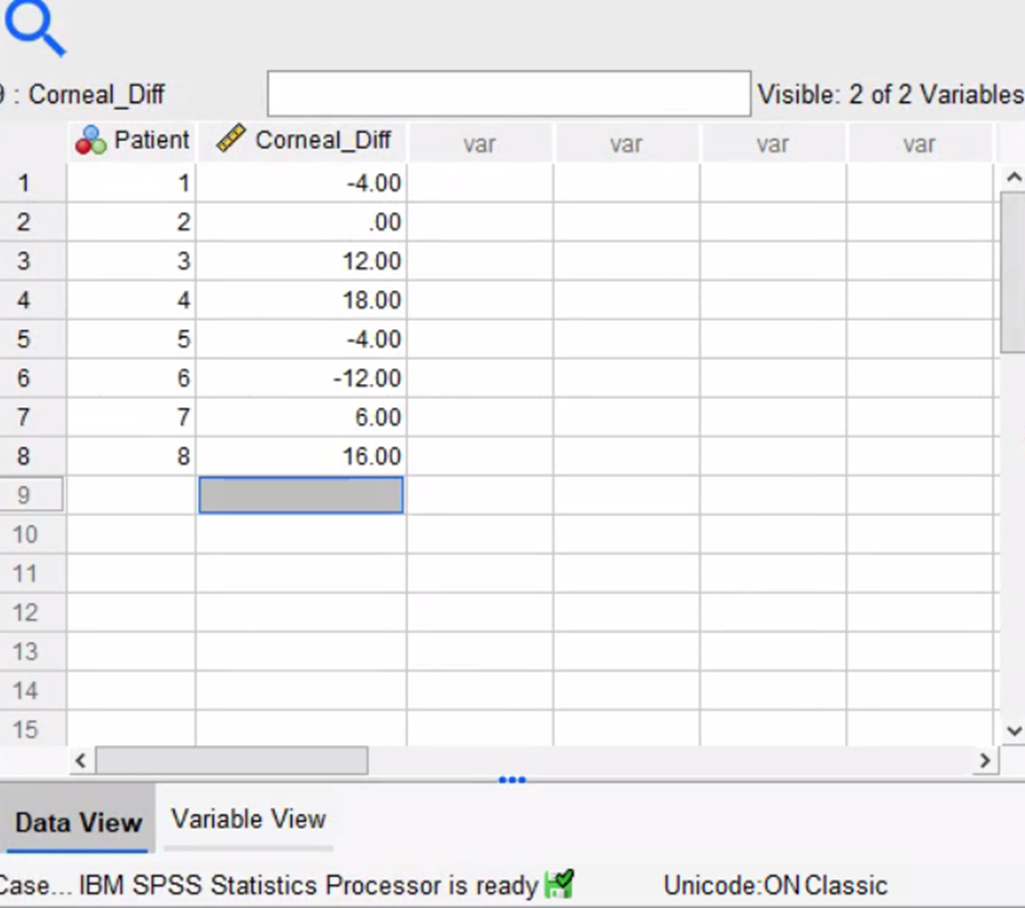
Glaucoma is a leading cause of blindness in the United States, N. Ehlers measured the difference in corneal thickness (in microns) between the two eyes of eight patients. Each patient had one eye that had glaucoma and one eye that was normal. The difference was measured as the corneal thickness of normal eye – corneal thickness of eye with Glaucoma. Corneal thickness is important because it can mask an accurate reading of eye pressure. Use ? = .05. Hypothesis: H0: μd=0Ha: μd≠0 Using output


Glaucoma is a leading cause of blindness in the United States, N. Ehlers measured the difference in corneal thickness (in microns) between the two eyes of eight patients. Each patient had one eye that had glaucoma and one eye that was normal. The difference was measured as the corneal thickness of normal eye – corneal thickness of eye with Glaucoma. Corneal thickness is important because it can mask an accurate reading of eye pressure. Use ? = .05.
Hypothesis:
H0: μd=0Ha: μd≠0
Using output
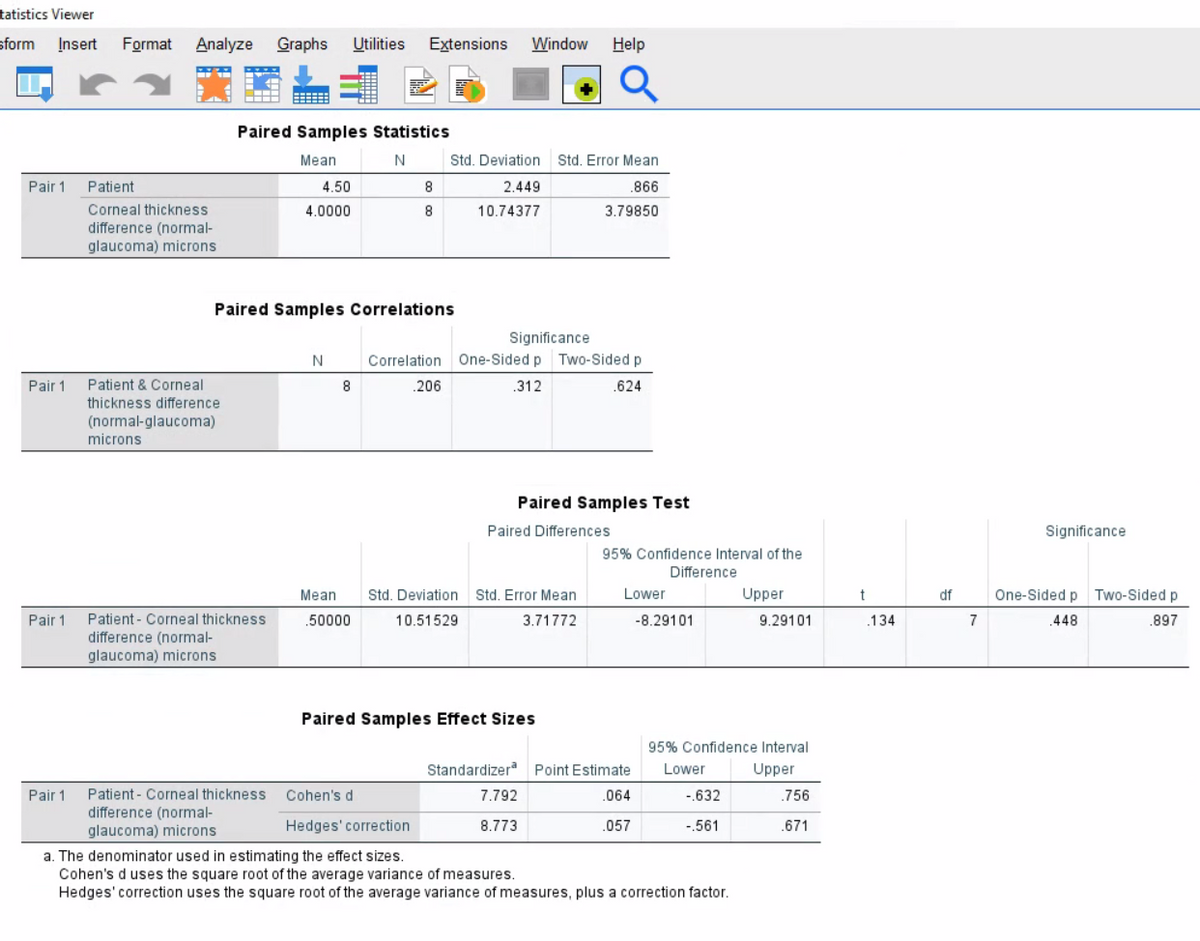
Test statistics :
t=0.134P value=0.897
Degrees of freedom (df):
df=7
Level of significance:
α=0.05
Decision:
P value > 0.05 thus we fails to reject null hypothesis.
Question
a)Write a report summarizing your findings. When writing the
report consider that medical staff estimate that a difference of 4.5 microns or more could impact on their ability to interpret eye pressure correctly.
b) Define for the hypothesis stated in part b) what a type 1 error and type 2 error would mean. Is it possible that we could have committed a type 2 error in conducting the test in part b)?

Step by step
Solved in 2 steps
