graph depicts an economy originally in equilibrium at point e. Assume that the government uses expansionary fiscal policy. The movement from point a to point b is due to
graph depicts an economy originally in equilibrium at point e. Assume that the government uses expansionary fiscal policy. The movement from point a to point b is due to

Managerial Economics: Applications, Strategies and Tactics (MindTap Course List)
14th Edition
ISBN:9781305506381
Author:James R. McGuigan, R. Charles Moyer, Frederick H.deB. Harris
Publisher:James R. McGuigan, R. Charles Moyer, Frederick H.deB. Harris
Chapter5: Business And Economic Forecasting
Section: Chapter Questions
Problem 4E

Related questions
Question
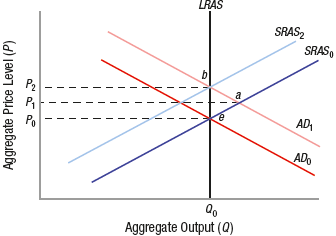
(Figure: Aggregate Demand and Supply) The graph depicts an economy originally in equilibrium at point e. Assume that the government uses expansionary fiscal policy. The movement from point a to point b is due to
- workers and suppliers adjusting their expectations to higher price levels.
- workers and suppliers adjusting their expectations to lower price levels.
- increased consumer spending brought about by increased government spending and/or lower taxes.
- decreased consumer spending brought about by increased government spending and/or lower taxes.
Transcribed Image Text:LRAS
SRAS2
SRAS,
b
P2
AD
Po
AD
Aggregate Output (0)
Aggregate Price Level (P)
Expert Solution
This question has been solved!
Explore an expertly crafted, step-by-step solution for a thorough understanding of key concepts.

This is a popular solution!

Trending now
This is a popular solution!

Step by step
Solved in 2 steps

Knowledge Booster


Learn more about
Need a deep-dive on the concept behind this application? Look no further. Learn more about this topic, economics and related others by exploring similar questions and additional content below.Recommended textbooks for you
Managerial Economics: Applications, Strategies an…
Economics
ISBN:
9781305506381
Author:
James R. McGuigan, R. Charles Moyer, Frederick H.deB. Harris
Publisher:
Cengage Learning
Managerial Economics: Applications, Strategies an…
Economics
ISBN:
9781305506381
Author:
James R. McGuigan, R. Charles Moyer, Frederick H.deB. Harris
Publisher:
Cengage Learning