Graph the function over a one-period interval. y = cot x+ Which graph below shows one period of the function? O A. O B. OC. D. 7x 11 11x 18 18 18 (31x 13m 13x 36 36 (1-)
Graph the function over a one-period interval. y = cot x+ Which graph below shows one period of the function? O A. O B. OC. D. 7x 11 11x 18 18 18 (31x 13m 13x 36 36 (1-)

College Algebra (MindTap Course List)
12th Edition
ISBN:9781305652231
Author:R. David Gustafson, Jeff Hughes
Publisher:R. David Gustafson, Jeff Hughes
Chapter5: Exponential And Logarithmic Functions
Section5.2: Applications Of Exponential Functions
Problem 48E

Related questions
Question
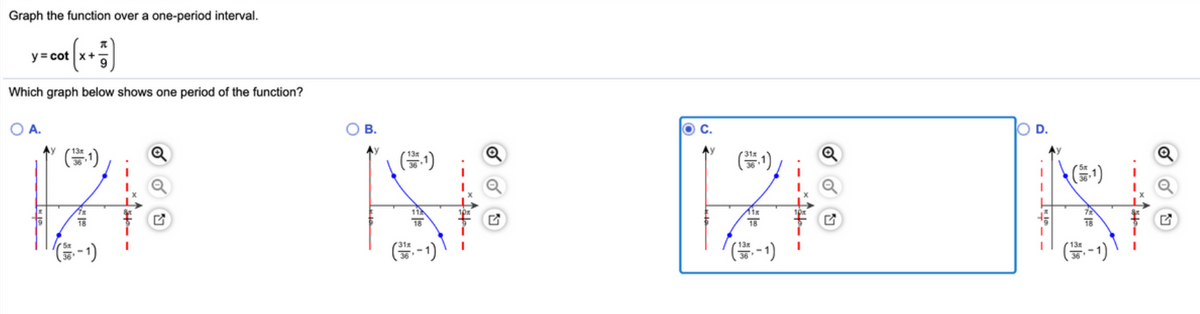
Transcribed Image Text:Graph the function over a one-period interval.
y = cot x+
Which graph below shows one period of the function?
O A.
O B.
OC.
D.
7x
11
11x
18
18
18
(31x
13m
13x
36
36
(1-)
Expert Solution
This question has been solved!
Explore an expertly crafted, step-by-step solution for a thorough understanding of key concepts.

This is a popular solution!

Trending now
This is a popular solution!

Step by step
Solved in 3 steps with 2 images

Recommended textbooks for you
College Algebra (MindTap Course List)
Algebra
ISBN:
9781305652231
Author:
R. David Gustafson, Jeff Hughes
Publisher:
Cengage Learning

Algebra & Trigonometry with Analytic Geometry
Algebra
ISBN:
9781133382119
Author:
Swokowski
Publisher:
Cengage
College Algebra (MindTap Course List)
Algebra
ISBN:
9781305652231
Author:
R. David Gustafson, Jeff Hughes
Publisher:
Cengage Learning
Algebra & Trigonometry with Analytic Geometry
Algebra
ISBN:
9781133382119
Author:
Swokowski
Publisher:
Cengage