Graph the logarithmic function g (x) = log, (r+ 1). To do this, plot two points on the graph of the function, and also draw the asymptote. Then, click on the graph-a-function button. Additionally, give the domain and range of the function using interval notation.
Graph the logarithmic function g (x) = log, (r+ 1). To do this, plot two points on the graph of the function, and also draw the asymptote. Then, click on the graph-a-function button. Additionally, give the domain and range of the function using interval notation.

Chapter6: Exponential And Logarithmic Functions
Section6.4: Graphs Of Logarithmic Functions
Problem 1SE: The inverse of every logarithmic function is anexponential function and vice-versa. What doesthis...

Related questions
Question
100%
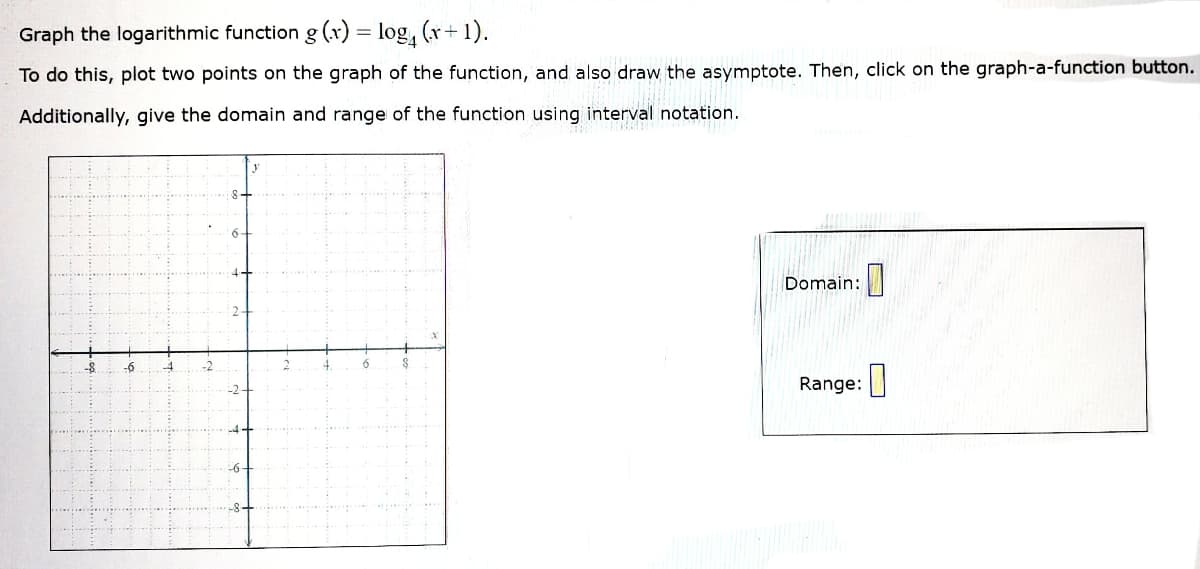
Transcribed Image Text:Graph the logarithmic function g (x) = log, (r+
1).
To do this, plot two points on the graph of the function, and also draw the asymptote. Then, click on the graph-a-function button.
Additionally, give the domain and range of the function using interval notation.
Domain:
-S
-4
4.
Range:|
Expert Solution
This question has been solved!
Explore an expertly crafted, step-by-step solution for a thorough understanding of key concepts.

Step by step
Solved in 2 steps with 1 images

Recommended textbooks for you

College Algebra
Algebra
ISBN:
9781305115545
Author:
James Stewart, Lothar Redlin, Saleem Watson
Publisher:
Cengage Learning

Algebra & Trigonometry with Analytic Geometry
Algebra
ISBN:
9781133382119
Author:
Swokowski
Publisher:
Cengage
College Algebra
Algebra
ISBN:
9781305115545
Author:
James Stewart, Lothar Redlin, Saleem Watson
Publisher:
Cengage Learning
Algebra & Trigonometry with Analytic Geometry
Algebra
ISBN:
9781133382119
Author:
Swokowski
Publisher:
Cengage

Algebra for College Students
Algebra
ISBN:
9781285195780
Author:
Jerome E. Kaufmann, Karen L. Schwitters
Publisher:
Cengage Learning

Trigonometry (MindTap Course List)
Trigonometry
ISBN:
9781337278461
Author:
Ron Larson
Publisher:
Cengage Learning
