Graph the trigonometric function. y=-2 cos -1 Plot all points corresponding to minima and maxima within one cycle. Within that cycle, also plot all points along the "midline" (points whose y-coordinates are midway between the function's minimum and maximum values). Then click on the graph-a-function button.
Graph the trigonometric function. y=-2 cos -1 Plot all points corresponding to minima and maxima within one cycle. Within that cycle, also plot all points along the "midline" (points whose y-coordinates are midway between the function's minimum and maximum values). Then click on the graph-a-function button.

Algebra & Trigonometry with Analytic Geometry
13th Edition
ISBN:9781133382119
Author:Swokowski
Publisher:Swokowski
Chapter6: The Trigonometric Functions
Section6.6: Additional Trigonometric Graphs
Problem 59E

Related questions
Question
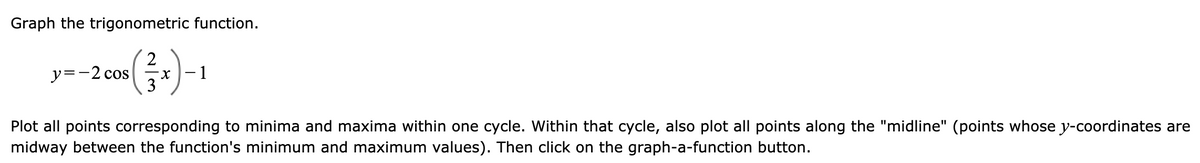
Transcribed Image Text:Graph the trigonometric function.
y=-2 cos
2
x- 1
Plot all points corresponding to minima and maxima within one cycle. Within that cycle, also plot all points along the "midline" (points whose y-coordinates are
midway between the function's minimum and maximum values). Then click on the graph-a-function button.
Expert Solution
This question has been solved!
Explore an expertly crafted, step-by-step solution for a thorough understanding of key concepts.

This is a popular solution!

Trending now
This is a popular solution!

Step by step
Solved in 5 steps with 1 images

Knowledge Booster


Learn more about
Need a deep-dive on the concept behind this application? Look no further. Learn more about this topic, advanced-math and related others by exploring similar questions and additional content below.Recommended textbooks for you
Algebra & Trigonometry with Analytic Geometry
Algebra
ISBN:
9781133382119
Author:
Swokowski
Publisher:
Cengage

College Algebra (MindTap Course List)
Algebra
ISBN:
9781305652231
Author:
R. David Gustafson, Jeff Hughes
Publisher:
Cengage Learning
Algebra & Trigonometry with Analytic Geometry
Algebra
ISBN:
9781133382119
Author:
Swokowski
Publisher:
Cengage
College Algebra (MindTap Course List)
Algebra
ISBN:
9781305652231
Author:
R. David Gustafson, Jeff Hughes
Publisher:
Cengage Learning