Group Statistics Std. Std. Error Neighbourhood Trips A N Mean Deviation Mean 7 22.29 16.760 6.335 B 43.29 19.474 7.360 Independent Samples Test Levene's Test for Equality of Variances t-test for Equality of Means Sig. (2- tailed) Difference Difference Mean Std. Error F t df Trips Equal variances .349 Sig. .566 -2.16 12 .051 -21.000 9.711 assumed Equal variances -2.16 11.7 .052 -21.000 9.711 not assumed Information is collected by a researcher from 14 people on their use of mass transit. Seven individuals were from Neighbourhood A and seven were from Neighbourhood B. The data were entered into SPSS and an independent samples t-test was performed to test the following hypotheses, with a = 0.05. HO: The mean number of mass transit trips is equal for both neighbourhoods; µA = uB H1: Use of the mass transit system varies between people from Neighborhood A and Neighbourhood B: HA * µB From the SPSS output above, you may assume that the variance of the sample from Neighorhood A is equal to the variance of the samples from Neighborhood B. Given the hypotheses, what is the p-value that should be used to draw a conclusion about the difference in means?
Group Statistics Std. Std. Error Neighbourhood Trips A N Mean Deviation Mean 7 22.29 16.760 6.335 B 43.29 19.474 7.360 Independent Samples Test Levene's Test for Equality of Variances t-test for Equality of Means Sig. (2- tailed) Difference Difference Mean Std. Error F t df Trips Equal variances .349 Sig. .566 -2.16 12 .051 -21.000 9.711 assumed Equal variances -2.16 11.7 .052 -21.000 9.711 not assumed Information is collected by a researcher from 14 people on their use of mass transit. Seven individuals were from Neighbourhood A and seven were from Neighbourhood B. The data were entered into SPSS and an independent samples t-test was performed to test the following hypotheses, with a = 0.05. HO: The mean number of mass transit trips is equal for both neighbourhoods; µA = uB H1: Use of the mass transit system varies between people from Neighborhood A and Neighbourhood B: HA * µB From the SPSS output above, you may assume that the variance of the sample from Neighorhood A is equal to the variance of the samples from Neighborhood B. Given the hypotheses, what is the p-value that should be used to draw a conclusion about the difference in means?

Glencoe Algebra 1, Student Edition, 9780079039897, 0079039898, 2018
18th Edition
ISBN:9780079039897
Author:Carter
Publisher:Carter
Chapter10: Statistics
Section10.4: Distributions Of Data
Problem 19PFA

Related questions
Question
Transcribed Image Text:Group Statistics
Std.
Std. Error
Neighbourhood
N
Мean
Deviation
Mean
Trips A
7
22.29
16.760
6.335
B
7
43.29
19.474
7.360
Independent Samples Test
Levene's Test
for Equality of
Variances
t-test for Equality of Means
Sig.
(2-
tailed) Difference Difference
Mean
Std. Error
Sig.
.566 -2.16
t
df
Trips Equal variances .349
12
.051
-21.000
9.711
assumed
-2.16 11.7
Equal variances
not assumed
.052
-21.000
9.711
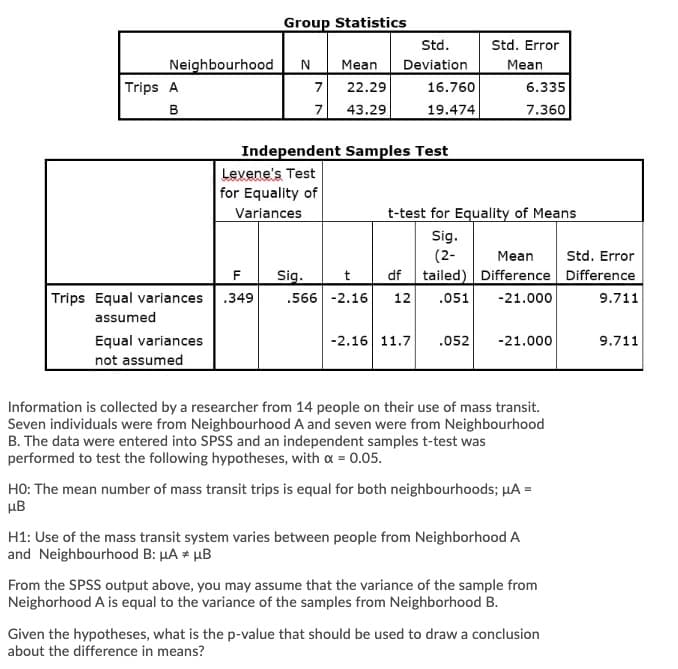
Information is collected by a researcher from 14 people on their use of mass transit.
Seven individuals were from Neighbourhood A and seven were from Neighbourhood
B. The data were entered into SPSS and an independent samples t-test was
performed to test the following hypotheses, with a = 0.05.
HO: The mean number of mass transit trips is equal for both neighbourhoods; µA =
µB
H1: Use of the mass transit system varies between people from Neighborhood A
and Neighbourhood B: µA + µB
From the SPSS output above, you may assume that the variance of the sample from
Neighorhood A is equal to the variance of the samples from Neighborhood B.
Given the hypotheses, what is the p-value that should be used to draw a conclusion
about the difference in means?
Expert Solution
This question has been solved!
Explore an expertly crafted, step-by-step solution for a thorough understanding of key concepts.

Step by step
Solved in 2 steps

Recommended textbooks for you
Glencoe Algebra 1, Student Edition, 9780079039897…
Algebra
ISBN:
9780079039897
Author:
Carter
Publisher:
McGraw Hill
Glencoe Algebra 1, Student Edition, 9780079039897…
Algebra
ISBN:
9780079039897
Author:
Carter
Publisher:
McGraw Hill