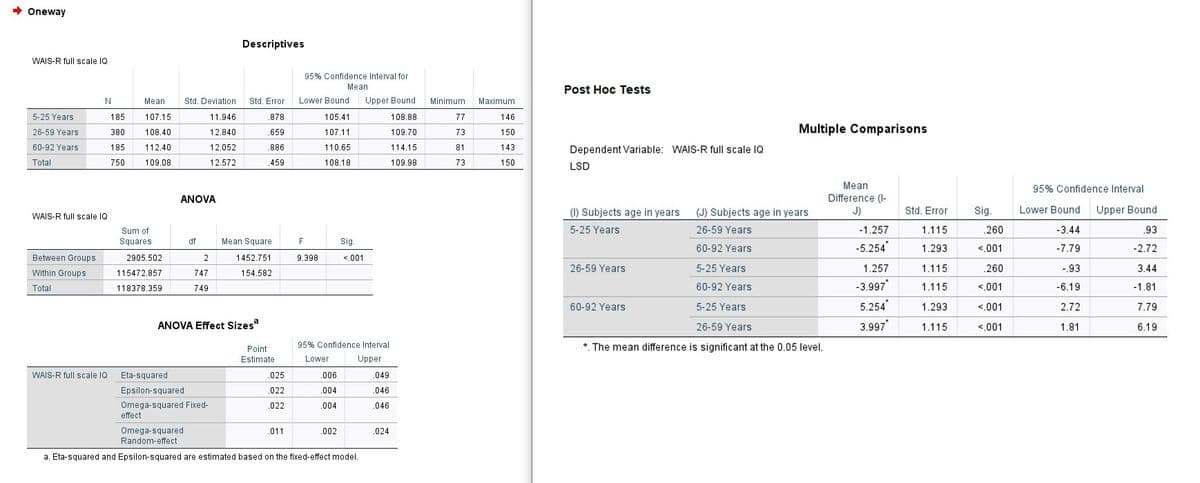
Groups: 1 = 5-25 years, 2 = 26-59 years, 3 = 60-92 years Which of the following statements is true of Group 1’s mean FIQ score? Group of answer choices: 1. Group 1’s mean FIQ score is not significantly different from Group 2’s mean FIQ score 2. Group 1’s mean FIQ score is significantly different from Group 2’s mean FIQ score 3. Group 1’s mean FIQ score is significantly higher than Group 2’s mean FIQ score 4. Group 1’s mean FIQ score is significantly lower than Group 2’s mean FIQ score 5. None of the above
Groups: 1 = 5-25 years, 2 = 26-59 years, 3 = 60-92 years Which of the following statements is true of Group 1’s mean FIQ score? Group of answer choices: 1. Group 1’s mean FIQ score is not significantly different from Group 2’s mean FIQ score 2. Group 1’s mean FIQ score is significantly different from Group 2’s mean FIQ score 3. Group 1’s mean FIQ score is significantly higher than Group 2’s mean FIQ score 4. Group 1’s mean FIQ score is significantly lower than Group 2’s mean FIQ score 5. None of the above

A First Course in Probability (10th Edition)
10th Edition
ISBN:9780134753119
Author:Sheldon Ross
Publisher:Sheldon Ross
Chapter1: Combinatorial Analysis
Section: Chapter Questions
Problem 1.1P: a. How many different 7-place license plates are possible if the first 2 places are for letters and...

Related questions
Question
Groups: 1 = 5-25 years, 2 = 26-59 years, 3 = 60-92 years
Which of the following statements is true of Group 1’s mean FIQ score?
Group of answer choices:
1. Group 1’s mean FIQ score is not significantly different from Group 2’s mean FIQ score
2. Group 1’s mean FIQ score is significantly different from Group 2’s mean FIQ score
3. Group 1’s mean FIQ score is significantly higher than Group 2’s mean FIQ score
4. Group 1’s mean FIQ score is significantly lower than Group 2’s mean FIQ score
5. None of the above
Transcribed Image Text:Oneway
Descriptives
WAIS-R full scale IQ
95% Confidence Interval for
Mean
Post Hoc Tests
Mean
Std. Deviation
Std. Error
Lower Bound
Upper Bound
Minimum
Maximum
5-25 Years
185
107.15
11.946
.878
105.41
108.88
77
146
26-59 Years
Multiple Comparisons
380
108.40
12.840
.659
107.11
109.70
73
150
60-92 Years
185
112.40
12.052
.886
110.65
114.15
81
143
Dependent Variable: WAIS-R full scale IQ
Total
750
109.08
12.572
459
108.18
109.98
73
150
LSD
Mean
Difference (I-
J)
95% Confidence Interval
ANOVA
(1) Subjects age in years
(J) Subjects age in years
Std. Error
Sig.
Lower Bound Upper Bound
WAIS-R full scale IQ
Sum of
5-25 Years
26-59 Years
-1.257
1.115
.260
-3.44
.93
Squares
df
Mean Square
F
Sig.
60-92 Years
-5.254
1.293
<.001
-7.79
-2.72
Between Groups
2905.502
2
1452.751
9.398
<.001
26-59 Years
5-25 Years
1.257
1.115
.260
-.93
3.44
Within Groups
115472.857
747
154.582
60-92 Years
-3.997"
1.115
<.001
-6.19
-1.81
Total
118378.359
749
60-92 Years
5-25 Years
5.254
1.293
<.001
2.72
7.79
ANOVA Effect Sizes
26-59 Years
3.997
1.115
<,001
1.81
6.19
Point
95% Confidence Interval
*. The mean difference is significant at the 0.05 level.
Estimate
Lower
Upper
WAIS-R full scale IQ Eta-squared
.025
.006
.049
Epsilon-squared
.022
.004
.046
Omega-squared Fixed-
.022
.004
.046
effect
Omega-squared
.011
.002
.024
Random-effect
a. Eta-squared and Epsilon-squared are estimated based on the fixed-effect model.
Expert Solution
This question has been solved!
Explore an expertly crafted, step-by-step solution for a thorough understanding of key concepts.

Step by step
Solved in 2 steps

Recommended textbooks for you
A First Course in Probability (10th Edition)
Probability
ISBN:
9780134753119
Author:
Sheldon Ross
Publisher:
PEARSON

A First Course in Probability (10th Edition)
Probability
ISBN:
9780134753119
Author:
Sheldon Ross
Publisher:
PEARSON