Suppose Consumer Reports would like to ipvestigate the relationship between the battery life, in hours, and the screen size, in diagonal inches, of a laptop computer. The following table shows a random sample of eight laptops and the battery life, in hours, and corresponding screen size, in inches, of each. Complete parts a through c. E Click the icon to view the data. a. Calculate the sample covariance. Data Table Sxy D (Type an integer or decimal rounded to three decimal places as needed.) Battery Life Screen Size b. Calculate the sample correlation coefficient. 3.4 15.8 4.5 17.5 (Type an integer or decimal rounded to three decimal places as needed.) 14.4 4.1 4.4 11.7 c. Describe the relationship between x and y 3.1 14.4 V relationship between these two variables. As screen size increases, battery life tends to 3.2 13.2 There is 4.7 11.5 3.8 13.6
Suppose Consumer Reports would like to ipvestigate the relationship between the battery life, in hours, and the screen size, in diagonal inches, of a laptop computer. The following table shows a random sample of eight laptops and the battery life, in hours, and corresponding screen size, in inches, of each. Complete parts a through c. E Click the icon to view the data. a. Calculate the sample covariance. Data Table Sxy D (Type an integer or decimal rounded to three decimal places as needed.) Battery Life Screen Size b. Calculate the sample correlation coefficient. 3.4 15.8 4.5 17.5 (Type an integer or decimal rounded to three decimal places as needed.) 14.4 4.1 4.4 11.7 c. Describe the relationship between x and y 3.1 14.4 V relationship between these two variables. As screen size increases, battery life tends to 3.2 13.2 There is 4.7 11.5 3.8 13.6

Glencoe Algebra 1, Student Edition, 9780079039897, 0079039898, 2018
18th Edition
ISBN:9780079039897
Author:Carter
Publisher:Carter
Chapter10: Statistics
Section10.4: Distributions Of Data
Problem 19PFA

Related questions
Question
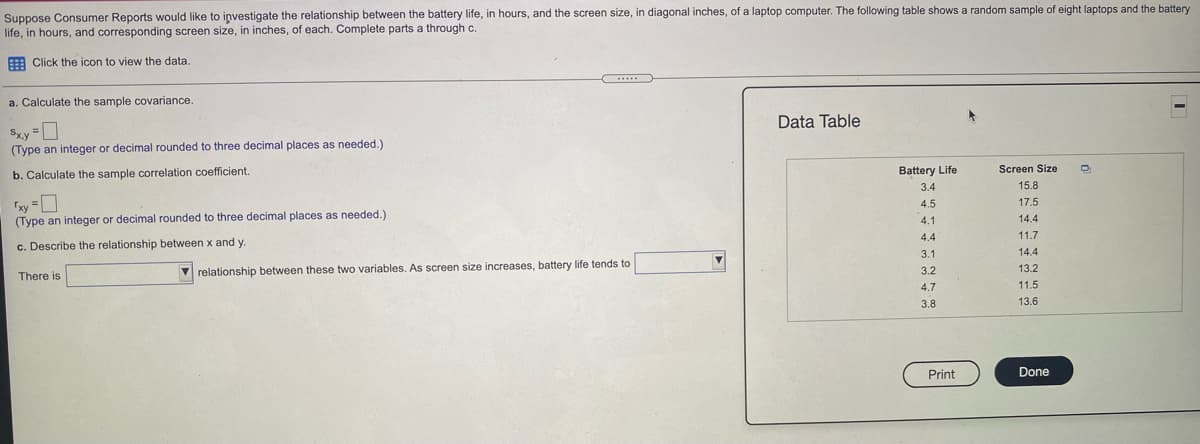
Transcribed Image Text:Suppose Consumer Reports would like to iņvestigate the relationship between the battery life, in hours, and the screen size, in diagonal inches, of a laptop computer. The following table shows a random sample of eight laptops and the battery
life, in hours, and corresponding screen size, in inches, of each. Complete parts a through c.
A Click the icon to view the data.
a. Calculate the sample covariance.
Data Table
Sxy D
(Type an integer
decimal rounded to three decimal places as needed.)
b. Calculate the sample correlation coefficient.
Battery Life
Screen Size
3.4
15.8
4.5
17.5
14 4
(Type an integer or decimal rounded to three decimal places as needed.)
4.1
4.4
11.7
c. Describe the relationship between x and y
3.1
14.4
V relationship between these two variables. As screen size increases, battery life tends to
3.2
13.2
There is
4.7
11.5
3.8
13.6
Print
Done
Expert Solution
This question has been solved!
Explore an expertly crafted, step-by-step solution for a thorough understanding of key concepts.

Step by step
Solved in 3 steps

Recommended textbooks for you
Glencoe Algebra 1, Student Edition, 9780079039897…
Algebra
ISBN:
9780079039897
Author:
Carter
Publisher:
McGraw Hill
Glencoe Algebra 1, Student Edition, 9780079039897…
Algebra
ISBN:
9780079039897
Author:
Carter
Publisher:
McGraw Hill