half is in another. Please provide t critical value, t calculated value, and if you rejected or accepted the null hypothesis that ponds have lower hardnes
half is in another. Please provide t critical value, t calculated value, and if you rejected or accepted the null hypothesis that ponds have lower hardnes
Glencoe Algebra 1, Student Edition, 9780079039897, 0079039898, 2018
18th Edition
ISBN:9780079039897
Author:Carter
Publisher:Carter
Chapter10: Statistics
Section10.3: Measures Of Spread
Problem 1GP
Related questions
Question
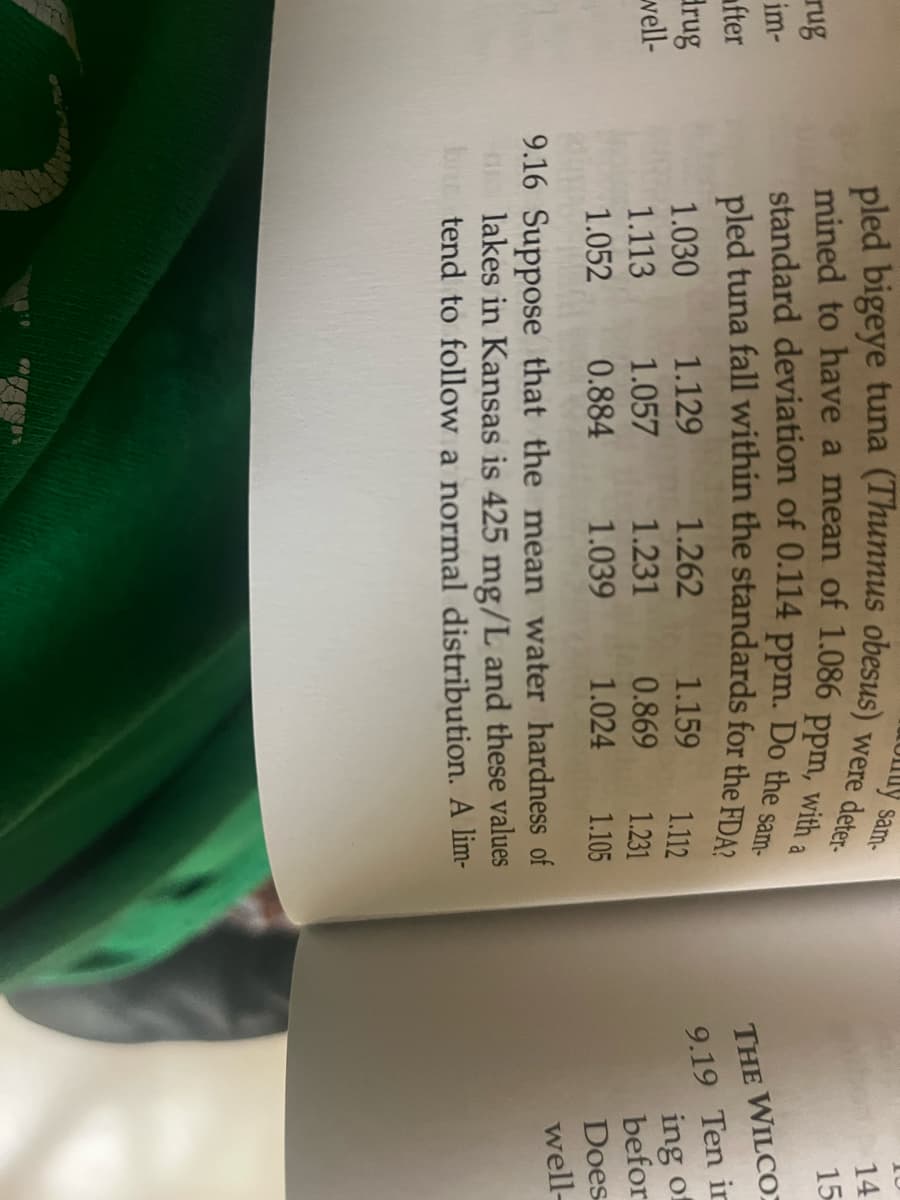
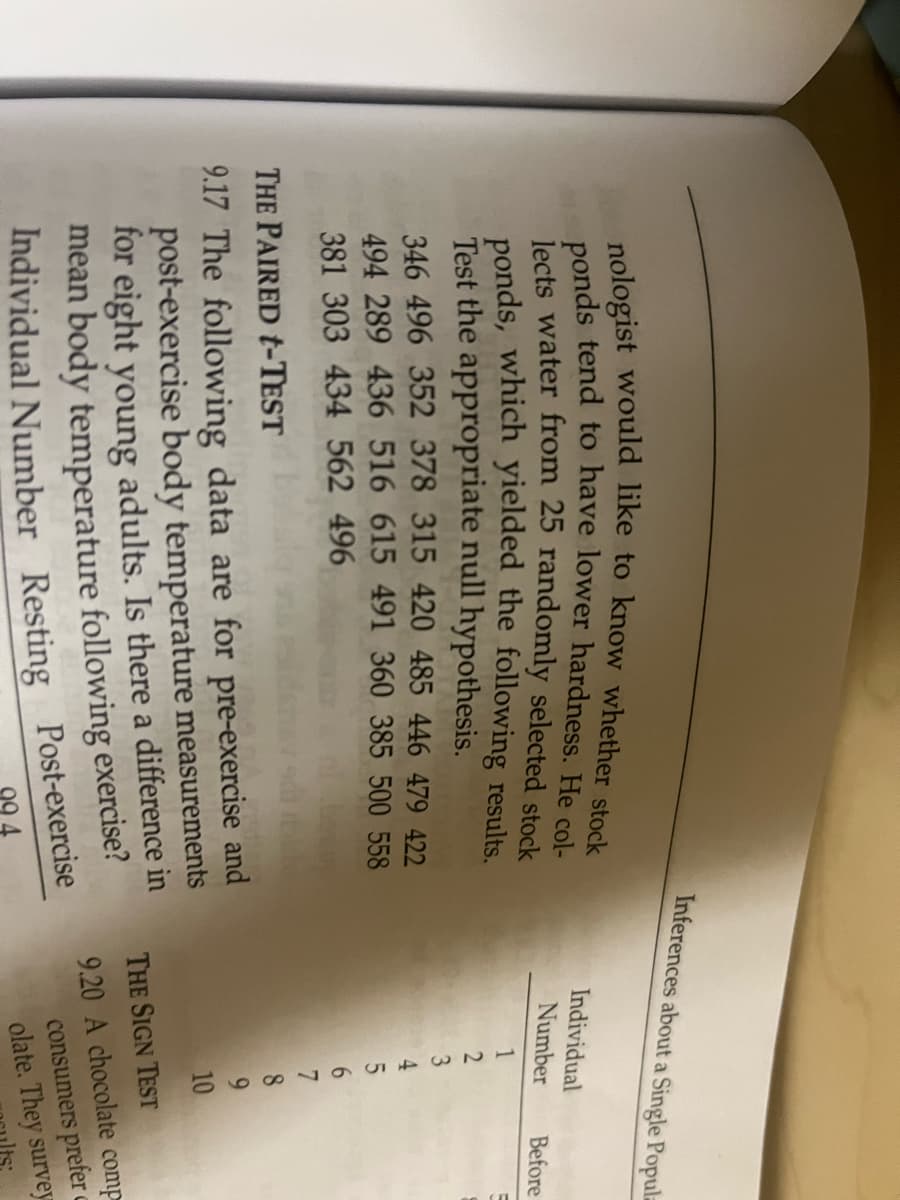
Please answer question 9.16 half of the question is in one photo and half is in another. Please provide t critical value, t calculated value, and if you rejected or accepted the null hypothesis that ponds have lower hardness

Transcribed Image Text:rug
im-
fter
Brug
well-
pled bigeye tuna (Thunnus obesus)
mined to have a mean of 1.086 ppm, with a
ppm.
Do the sam-
standard deviation of 0.114
pled tuna fall within the standards for the FDA?
1.030
1.113
1.052
1.129
1.057
0.884
1.262
1.231
1.039
uy sam-
were deter-
1.159
1.112
0.869
1.231
1.024 1.105
9.16 Suppose that the mean water hardness of
lakes in Kansas is 425 mg/L and these values
bne tend to follow a normal distribution. A lim-
14
15
THE WILCO
9.19 Ten ir
ing of
befor
Does
well-

Transcribed Image Text:nologist would like to know whether stock
ponds tend to have lower hardness. He col-
lects water from 25 randomly selected stock
ponds, which yielded the following results.
Test the appropriate null hypothesis.
346 496 352 378 315 420 485 446 479 422
494 289 436 516 615 491 360 385 500 558
381 303 434 562 496
Inferences about a Single Popula
THE PAIRED t-TEST
9.17 The following data are for pre-exercise and
post-exercise body temperature measurements
for eight young adults. Is there a difference in
mean body temperature following exercise?
Individual Number Resting Post-exercise
Individual
Number
1
2
3
7
9
10
Before
THE SIGN TEST
9.20 A chocolate comp
consumers prefer
olate. They survey
Expert Solution
This question has been solved!
Explore an expertly crafted, step-by-step solution for a thorough understanding of key concepts.
Step by step
Solved in 2 steps with 1 images

Recommended textbooks for you

Glencoe Algebra 1, Student Edition, 9780079039897…
Algebra
ISBN:
9780079039897
Author:
Carter
Publisher:
McGraw Hill

Glencoe Algebra 1, Student Edition, 9780079039897…
Algebra
ISBN:
9780079039897
Author:
Carter
Publisher:
McGraw Hill