hat is the relationship between the attendance at a major league ball game and the total number of runs Attendance figures (in thousands) and the runs scored for 12 randomly selected games are shown pred? ow. Attendance Runs 19 35 29 37 59 25 30 8 10 10 14 5 4 51 19 34 56 13 379 3 8 a. Find the correlation coefficient: r = b. The null and alternative hypotheses for correlation are: Ho:?V=0 H₁: ? #0 The p-value is: Round to 2 decimal places. (Round to four decimal places) c. Use a level of significance of a = 0.05 to state the conclusion of the hypothesis test in the context of the study. There is statistically significant evidence to conclude that there is a correlation between the attendance of baseball games and the runs scored. Thus, the regression line is useful. There is statistically significant evidence to conclude that a game with higher attendance will have fewer runs scored than a game with lower attendance. There is statistically significant evidence to conclude that a game with a higher attendance will have more runs scored than a game with lower attendance. d. The equation of the linear regression line is: ŷ= There is statistically insignificant evidence to conclude that there is a correlation between the attendance of baseball games and the runs scored. Thus, the use of the regression line is not appropriate. (Please show your answers to two decimal places) e. Use the model to predict the runs scored at a game that has an attendance of 6 thousand people. Runs scored - (Please round to two decimal places.) f. Interpret the slope of the regression line in the context of the question:
hat is the relationship between the attendance at a major league ball game and the total number of runs Attendance figures (in thousands) and the runs scored for 12 randomly selected games are shown pred? ow. Attendance Runs 19 35 29 37 59 25 30 8 10 10 14 5 4 51 19 34 56 13 379 3 8 a. Find the correlation coefficient: r = b. The null and alternative hypotheses for correlation are: Ho:?V=0 H₁: ? #0 The p-value is: Round to 2 decimal places. (Round to four decimal places) c. Use a level of significance of a = 0.05 to state the conclusion of the hypothesis test in the context of the study. There is statistically significant evidence to conclude that there is a correlation between the attendance of baseball games and the runs scored. Thus, the regression line is useful. There is statistically significant evidence to conclude that a game with higher attendance will have fewer runs scored than a game with lower attendance. There is statistically significant evidence to conclude that a game with a higher attendance will have more runs scored than a game with lower attendance. d. The equation of the linear regression line is: ŷ= There is statistically insignificant evidence to conclude that there is a correlation between the attendance of baseball games and the runs scored. Thus, the use of the regression line is not appropriate. (Please show your answers to two decimal places) e. Use the model to predict the runs scored at a game that has an attendance of 6 thousand people. Runs scored - (Please round to two decimal places.) f. Interpret the slope of the regression line in the context of the question:

Glencoe Algebra 1, Student Edition, 9780079039897, 0079039898, 2018
18th Edition
ISBN:9780079039897
Author:Carter
Publisher:Carter
Chapter4: Equations Of Linear Functions
Section4.5: Correlation And Causation
Problem 2CYU

Related questions
Question
fill in the blank pls!
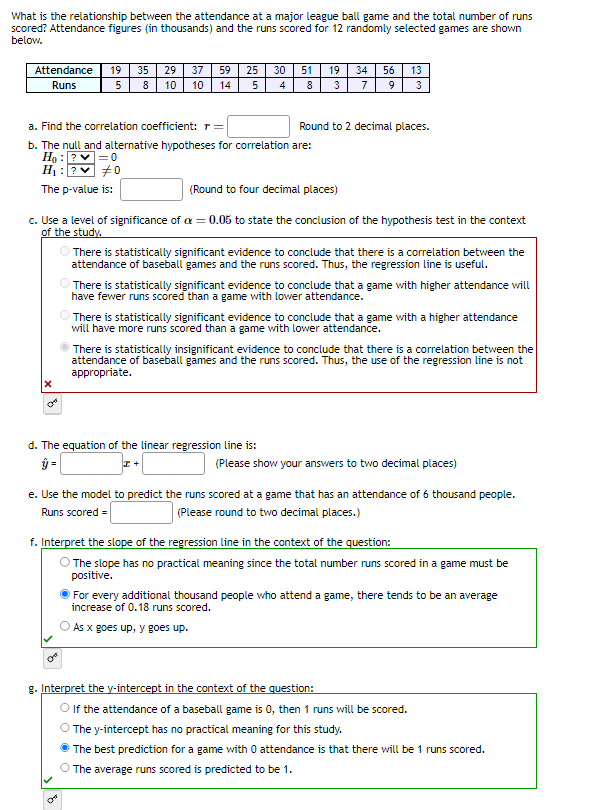
Transcribed Image Text:What is the relationship between the attendance at a major league ball game and the total number of runs
scored? Attendance figures (in thousands) and the runs scored for 12 randomly selected games are shown
below.
Attendance
Runs
19 35
5
8
X
o
29 37 59 25
10 10 14
5
a. Find the correlation coefficient: r =
b. The null and alternative hypotheses for correlation are:
H₂ : ? ✓=0
#0
H₁: ?
The p-value is:
30
4
(Round to four decimal places)
c. Use a level of significance of a = 0.05 to state the conclusion of the hypothesis test in the context
of the study.
51 19 34 56 13
8 3 7 9 3
Round to 2 decimal places.
There is statistically significant evidence to conclude that there is a correlation between the
attendance of baseball games and the runs scored. Thus, the regression line is useful.
There is statistically significant evidence to conclude that a game with higher attendance will
have fewer runs scored than a game with lower attendance.
d. The equation of the linear regression line is:
ý =
+ I
There is statistically significant evidence to conclude that a game with a higher attendance
will have more runs scored than a game with lower attendance.
There is statistically insignificant evidence to conclude that there is a correlation between the
attendance of baseball games and the runs scored. Thus, the use of the regression line is not
appropriate.
(Please show your answers to two decimal places)
e. Use the model to predict the runs scored at a game that has an attendance of 6 thousand people.
Runs scored =
(Please round to two decimal places.)
f. Interpret the slope of the regression line in the context of the question:
O The slope has no practical meaning since the total number runs scored in a game must be
positive.
For every additional thousand people who attend a game, there tends to be an average
increase of 0.18 runs scored.
As x goes up, y goes up.
g. Interpret the y-intercept in the context of the question:
O If the attendance of a baseball game is 0, then 1 runs will be scored.
The y-intercept has no practical meaning for this study.
The best prediction for a game with 0 attendance is that there will be 1 runs scored.
O The average runs scored is predicted to be 1.
Expert Solution
This question has been solved!
Explore an expertly crafted, step-by-step solution for a thorough understanding of key concepts.

Step by step
Solved in 5 steps with 4 images

Recommended textbooks for you
Glencoe Algebra 1, Student Edition, 9780079039897…
Algebra
ISBN:
9780079039897
Author:
Carter
Publisher:
McGraw Hill
Glencoe Algebra 1, Student Edition, 9780079039897…
Algebra
ISBN:
9780079039897
Author:
Carter
Publisher:
McGraw Hill