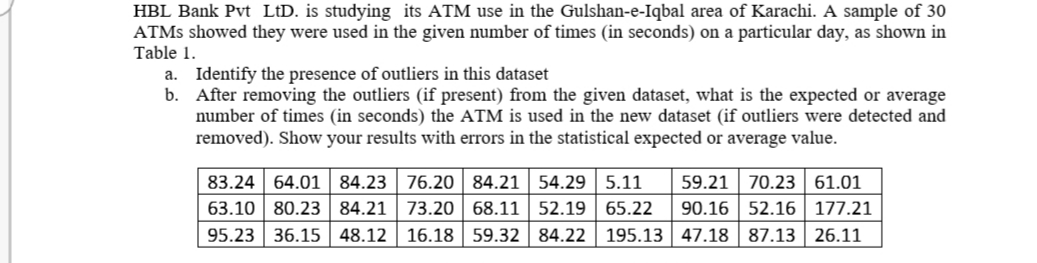
HBL Bank Pvt LtD. is studying its ATM use in the Gulshan-e-Iqbal area of Karachi. A sample of 30 ATMS showed they were used in the given number of times (in seconds) on a particular day, as shown in Table 1. a. Identify the presence of outliers in this dataset b. After removing the outliers (if present) from the given dataset, what is the expected or average number of times (in seconds) the ATM is used in the new dataset (if outliers were detected and removed). Show your results with errors in the statistical expected or average value. 84.23 76.20 84.21 54.29 | 5.11 63.10 80.23 84.21 | 73.20 68.11 | 52.19 | 65.22 59.21 70.23 61.01 90.16 52.16| 177.21 95.23 36.15| 48.12 | 16.18 59.32 | 84.22 | 195.13 | 47.18 | 87.13 | 26.11 83.24 64.01


Inverse Normal Distribution
The method used for finding the corresponding z-critical value in a normal distribution using the known probability is said to be an inverse normal distribution. The inverse normal distribution is a continuous probability distribution with a family of two parameters.
Mean, Median, Mode
It is a descriptive summary of a data set. It can be defined by using some of the measures. The central tendencies do not provide information regarding individual data from the dataset. However, they give a summary of the data set. The central tendency or measure of central tendency is a central or typical value for a probability distribution.
Z-Scores
A z-score is a unit of measurement used in statistics to describe the position of a raw score in terms of its distance from the mean, measured with reference to standard deviation from the mean. Z-scores are useful in statistics because they allow comparison between two scores that belong to different normal distributions.

Step by step
Solved in 3 steps with 1 images


