Measures of central tendency alone are insufficient to completely describe a sample because:
Measures of central tendency alone are insufficient to completely describe a sample because:

Glencoe Algebra 1, Student Edition, 9780079039897, 0079039898, 2018
18th Edition
ISBN:9780079039897
Author:Carter
Publisher:Carter
Chapter10: Statistics
Section10.4: Distributions Of Data
Problem 19PFA

Related questions
Question
Q7
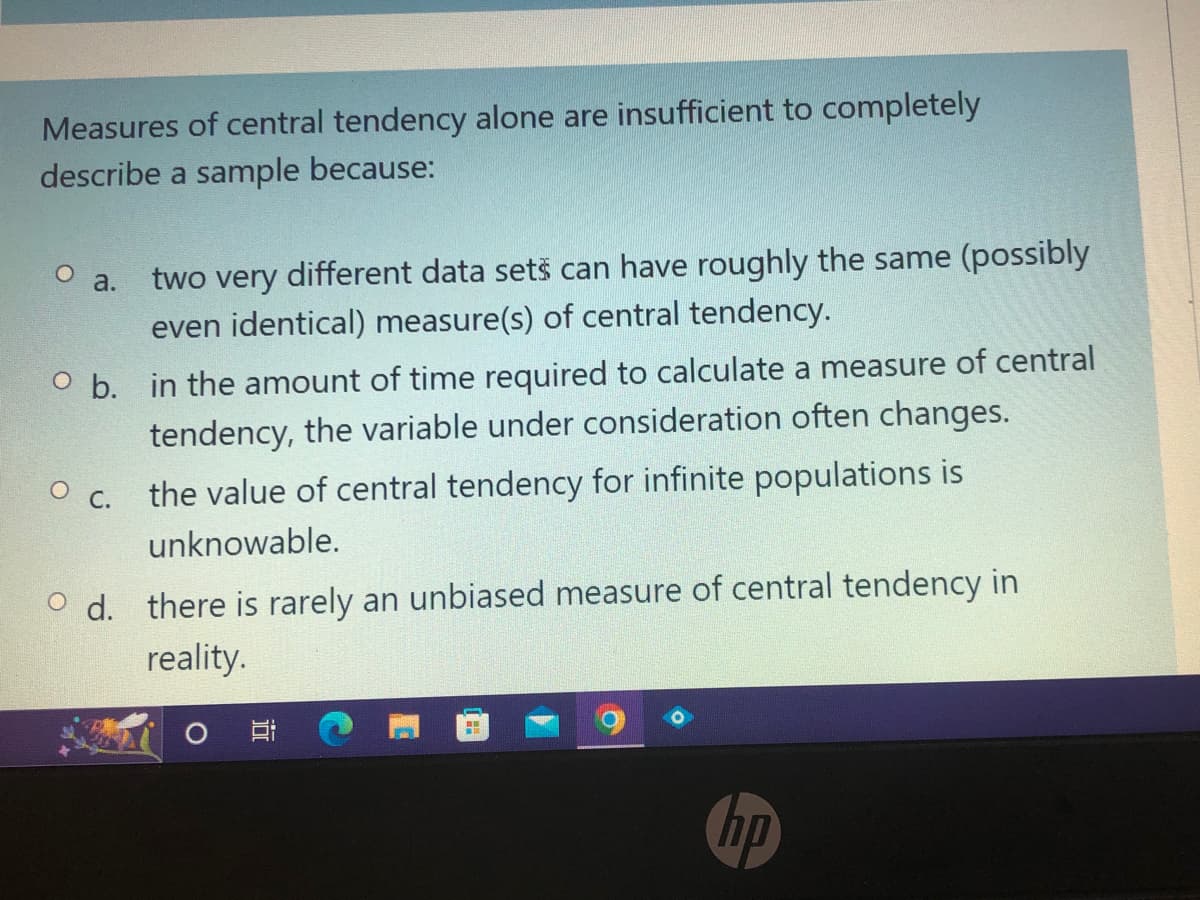
Transcribed Image Text:Measures of central tendency alone are insufficient to completely
describe a sample because:
O a.
two very different data sets can have roughly the same (possibly
even identical) measure(s) of central tendency.
O b. in the amount of time required to calculate a measure of central
tendency, the variable under consideration often changes.
O c. the value of central tendency for infinite populations is
unknowable.
Od. there is rarely an unbiased measure of central tendency in
reality.
AB
hp
Expert Solution
This question has been solved!
Explore an expertly crafted, step-by-step solution for a thorough understanding of key concepts.

Step by step
Solved in 2 steps

Recommended textbooks for you
Glencoe Algebra 1, Student Edition, 9780079039897…
Algebra
ISBN:
9780079039897
Author:
Carter
Publisher:
McGraw Hill

College Algebra (MindTap Course List)
Algebra
ISBN:
9781305652231
Author:
R. David Gustafson, Jeff Hughes
Publisher:
Cengage Learning
Glencoe Algebra 1, Student Edition, 9780079039897…
Algebra
ISBN:
9780079039897
Author:
Carter
Publisher:
McGraw Hill
College Algebra (MindTap Course List)
Algebra
ISBN:
9781305652231
Author:
R. David Gustafson, Jeff Hughes
Publisher:
Cengage Learning