he birth rate of a population is b(t) = 2000e0.021t people per year and the death rate is d(t)= 1500e0.017t people per year, find the area between these curves for 0 st s 10. (Round your answer to the nearest ger.) at does this area represent in the context of this problem? O This area represents the increase in population over a 10-year period. This area represents the number of deaths over a 10-year period. This area represents the decrease in population over a 10-year period. O This area represent the number of children through high school over a 10-year period. This area represents the number of birthe over a 10-year period
he birth rate of a population is b(t) = 2000e0.021t people per year and the death rate is d(t)= 1500e0.017t people per year, find the area between these curves for 0 st s 10. (Round your answer to the nearest ger.) at does this area represent in the context of this problem? O This area represents the increase in population over a 10-year period. This area represents the number of deaths over a 10-year period. This area represents the decrease in population over a 10-year period. O This area represent the number of children through high school over a 10-year period. This area represents the number of birthe over a 10-year period

Glencoe Algebra 1, Student Edition, 9780079039897, 0079039898, 2018
18th Edition
ISBN:9780079039897
Author:Carter
Publisher:Carter
Chapter7: Exponents And Exponential Functions
Section7.8: Transforming Exponential Expressions
Problem 13PFA

Related questions
Question
If the...
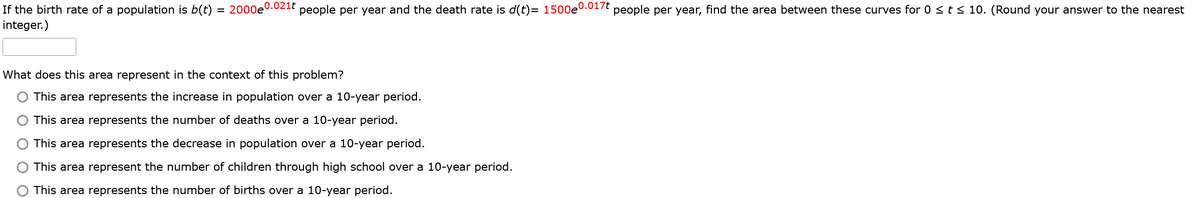
Transcribed Image Text:If the birth rate of a population is b(t) =
integer.)
2000e0.021t
people per year and the death rate is d(t)= 1500e0.017t
What does this area represent in the context of this problem?
This area represents the increase in population over a 10-year period.
This area represents the number of deaths over a 10-year period.
This area represents the decrease in population over a 10-year period.
This area represent the number of children through high school over a 10-year period.
This area represents the number of births over a 10-year period.
people per year, find the area between these curves for 0 ≤ t ≤ 10. (Round your answer to the nearest
Expert Solution
This question has been solved!
Explore an expertly crafted, step-by-step solution for a thorough understanding of key concepts.

This is a popular solution!

Trending now
This is a popular solution!

Step by step
Solved in 2 steps with 2 images

Recommended textbooks for you
Glencoe Algebra 1, Student Edition, 9780079039897…
Algebra
ISBN:
9780079039897
Author:
Carter
Publisher:
McGraw Hill

College Algebra
Algebra
ISBN:
9781305115545
Author:
James Stewart, Lothar Redlin, Saleem Watson
Publisher:
Cengage Learning

Trigonometry (MindTap Course List)
Trigonometry
ISBN:
9781337278461
Author:
Ron Larson
Publisher:
Cengage Learning
Glencoe Algebra 1, Student Edition, 9780079039897…
Algebra
ISBN:
9780079039897
Author:
Carter
Publisher:
McGraw Hill
College Algebra
Algebra
ISBN:
9781305115545
Author:
James Stewart, Lothar Redlin, Saleem Watson
Publisher:
Cengage Learning
Trigonometry (MindTap Course List)
Trigonometry
ISBN:
9781337278461
Author:
Ron Larson
Publisher:
Cengage Learning

Algebra & Trigonometry with Analytic Geometry
Algebra
ISBN:
9781133382119
Author:
Swokowski
Publisher:
Cengage


Algebra and Trigonometry (MindTap Course List)
Algebra
ISBN:
9781305071742
Author:
James Stewart, Lothar Redlin, Saleem Watson
Publisher:
Cengage Learning