he following ogives come from different distributions of 50 whole numbers between 1 and 60. Labels on each point give the cumulative frequency and the cumulative percentage of data. (Graphs are same for part) (d) Which distribution seems to be skewed right? (e) Which distribution seems to be skewed left? (f) Which distribution seems to be mound-shap


Inverse Normal Distribution
The method used for finding the corresponding z-critical value in a normal distribution using the known probability is said to be an inverse normal distribution. The inverse normal distribution is a continuous probability distribution with a family of two parameters.
Mean, Median, Mode
It is a descriptive summary of a data set. It can be defined by using some of the measures. The central tendencies do not provide information regarding individual data from the dataset. However, they give a summary of the data set. The central tendency or measure of central tendency is a central or typical value for a probability distribution.
Z-Scores
A z-score is a unit of measurement used in statistics to describe the position of a raw score in terms of its distance from the mean, measured with reference to standard deviation from the mean. Z-scores are useful in statistics because they allow comparison between two scores that belong to different normal distributions.
The following ogives come from different distributions of 50 whole numbers between 1 and 60. Labels on each point give the cumulative frequency and the cumulative percentage of data.
(Graphs are same for part)
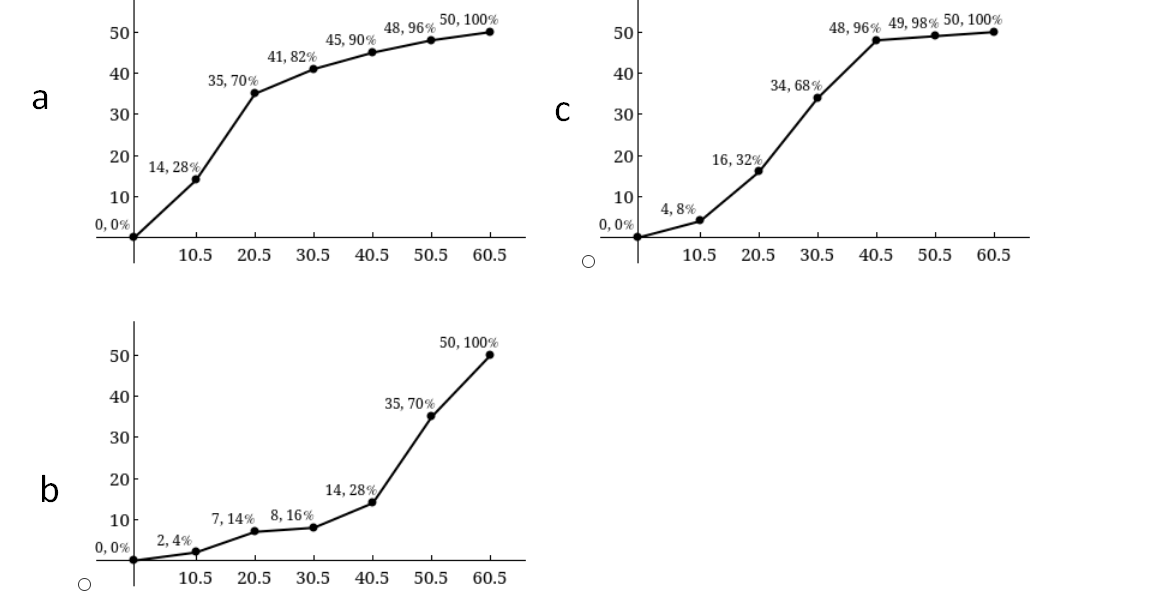
Given data is appropriate for skewness because to know weather it is which tail we are going for the distributions curve.

Trending now
This is a popular solution!

Step by step
Solved in 4 steps


