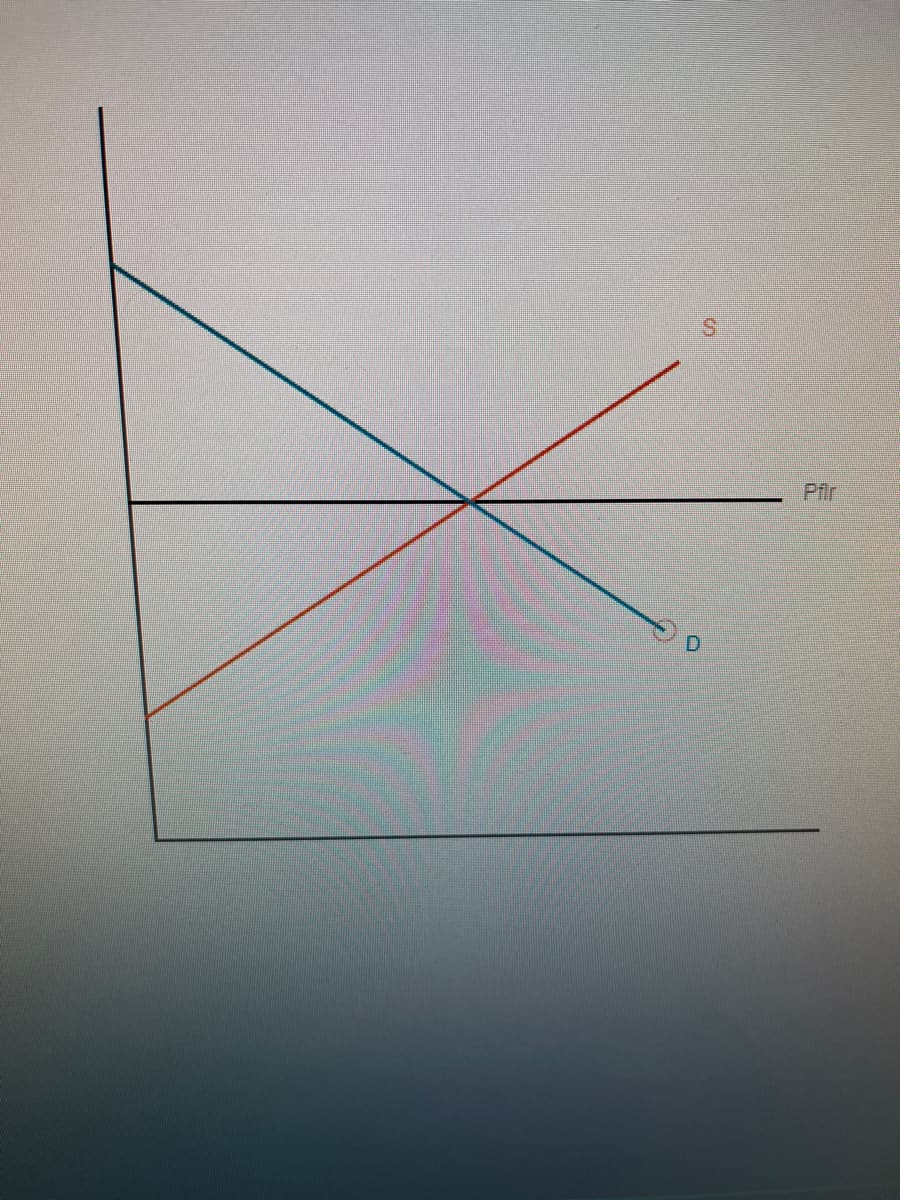
he graph shows a price floor (pflr) that at first happens to lie exactly at the equilibrium price for corn. The floor is intended to shore up the price of corn but is currently nonbinding. Then a new law about the use of (corn-derived) ethanol in gasoline causes a change in demand. Drag the appropriate curve to illustrate what happens if the change causes the floor to become binding
he graph shows a price floor (pflr) that at first happens to lie exactly at the equilibrium price for corn. The floor is intended to shore up the price of corn but is currently nonbinding. Then a new law about the use of (corn-derived) ethanol in gasoline causes a change in demand. Drag the appropriate curve to illustrate what happens if the change causes the floor to become binding

Principles of Economics 2e
2nd Edition
ISBN:9781947172364
Author:Steven A. Greenlaw; David Shapiro
Publisher:Steven A. Greenlaw; David Shapiro
Chapter22: Inflation
Section: Chapter Questions
Problem 18RQ: What is deflation?

Related questions
Question
The graph shows a price floor (pflr) that at first happens to lie exactly at the equilibrium price for corn. The floor is intended to shore up the price of corn but is currently nonbinding. Then a new law about the use of (corn-derived) ethanol in gasoline causes a change in demand . Drag the appropriate curve to illustrate what happens if the change causes the floor to become binding.
Transcribed Image Text:D
Pflr
Expert Solution
This question has been solved!
Explore an expertly crafted, step-by-step solution for a thorough understanding of key concepts.

This is a popular solution!

Trending now
This is a popular solution!

Step by step
Solved in 2 steps with 1 images

Knowledge Booster


Learn more about
Need a deep-dive on the concept behind this application? Look no further. Learn more about this topic, economics and related others by exploring similar questions and additional content below.Recommended textbooks for you
Principles of Economics 2e
Economics
ISBN:
9781947172364
Author:
Steven A. Greenlaw; David Shapiro
Publisher:
OpenStax
Principles of Economics 2e
Economics
ISBN:
9781947172364
Author:
Steven A. Greenlaw; David Shapiro
Publisher:
OpenStax