Heights (cm) and weights (kg) are measured for 100 randomly selected adult males, and range from heights of 136 to 190 cm and weights of 39 to 150 kg. Let the predictor variable x be the first variable given. The 100 paired measurements yi x= 167.51 cm, y= 81.36 kg, r= 0.232, P-value = 0.020, and y = - 103 + 1.13x. Find the best predicted value of y (weight) given an adult male who is 153 cm tall. Use a 0.01 significance level. The best predicted value of y for an adult male who is 153 cm tall is kg (Round to two decimal places as needed.)
Heights (cm) and weights (kg) are measured for 100 randomly selected adult males, and range from heights of 136 to 190 cm and weights of 39 to 150 kg. Let the predictor variable x be the first variable given. The 100 paired measurements yi x= 167.51 cm, y= 81.36 kg, r= 0.232, P-value = 0.020, and y = - 103 + 1.13x. Find the best predicted value of y (weight) given an adult male who is 153 cm tall. Use a 0.01 significance level. The best predicted value of y for an adult male who is 153 cm tall is kg (Round to two decimal places as needed.)

Linear Algebra: A Modern Introduction
4th Edition
ISBN:9781285463247
Author:David Poole
Publisher:David Poole
Chapter7: Distance And Approximation
Section7.3: Least Squares Approximation
Problem 31EQ

Related questions
Question
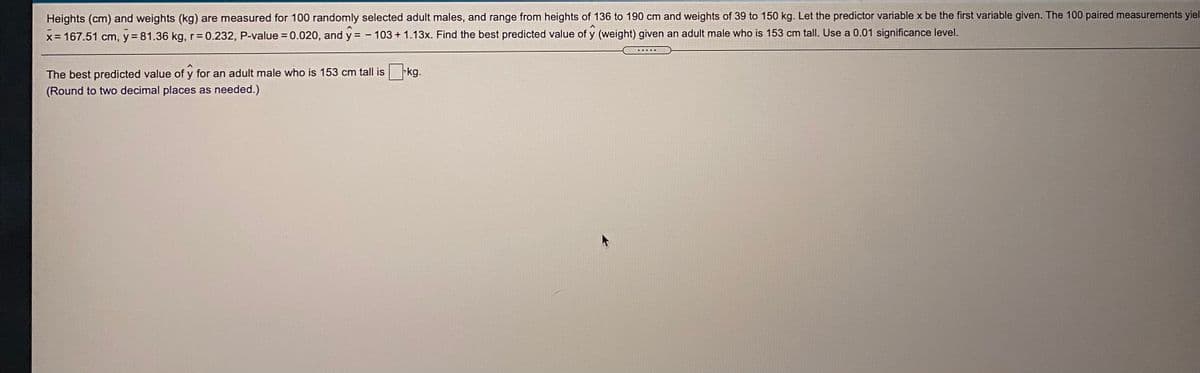
Transcribed Image Text:Heights (cm) and weights (kg) are measured for 100 randomly selected adult males, and range from heights of 136 to 190 cm and weights of 39 to 150 kg. Let the predictor variable x be the first variable given. The 100 paired measurements yiel
x= 167.51 cm, y = 81.36 kg,r= 0.232, P-value = 0.020, and y = - 103+ 1.13x. Find the best predicted value of y (weight) given an adult male who is 153 cm tall. Use a 0.01 significance level.
The best predicted value of y for an adult male who is 153 cm tall is
kg.
(Round to two decimal places as needed.)
Expert Solution
This question has been solved!
Explore an expertly crafted, step-by-step solution for a thorough understanding of key concepts.

This is a popular solution!

Trending now
This is a popular solution!

Step by step
Solved in 2 steps with 2 images

Recommended textbooks for you
Linear Algebra: A Modern Introduction
Algebra
ISBN:
9781285463247
Author:
David Poole
Publisher:
Cengage Learning

Glencoe Algebra 1, Student Edition, 9780079039897…
Algebra
ISBN:
9780079039897
Author:
Carter
Publisher:
McGraw Hill
Linear Algebra: A Modern Introduction
Algebra
ISBN:
9781285463247
Author:
David Poole
Publisher:
Cengage Learning
Glencoe Algebra 1, Student Edition, 9780079039897…
Algebra
ISBN:
9780079039897
Author:
Carter
Publisher:
McGraw Hill