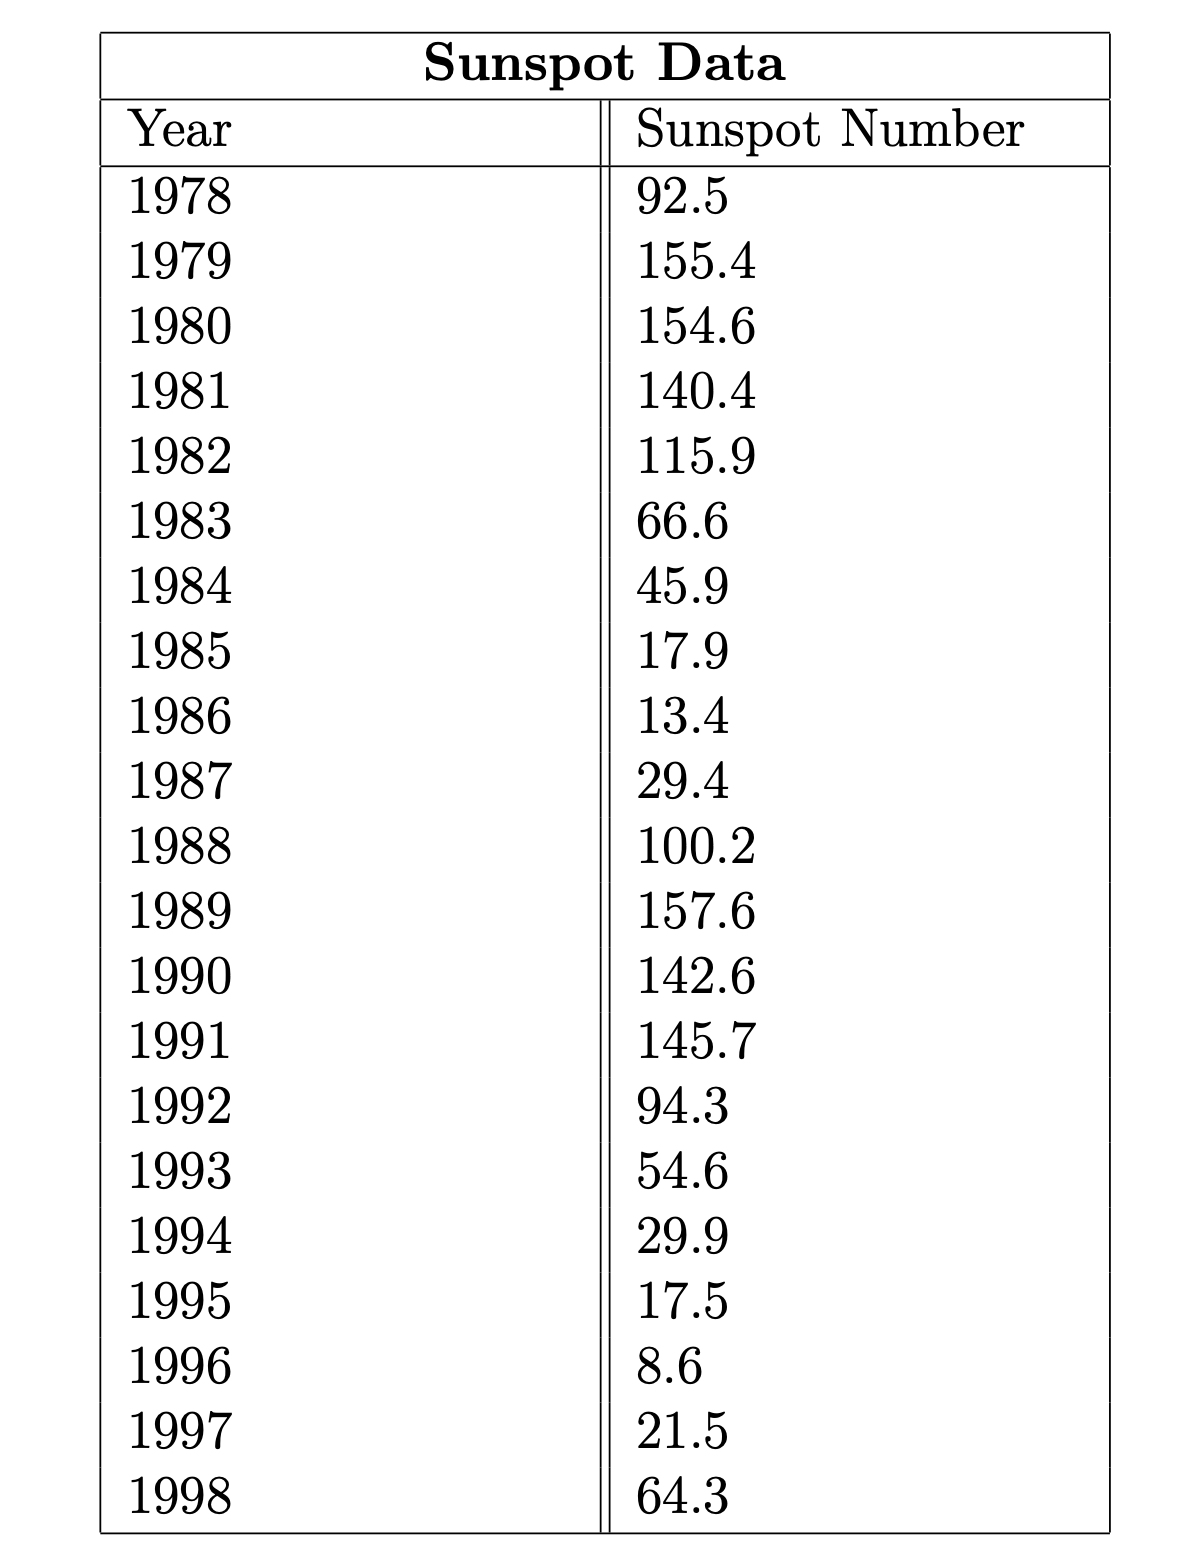
Hello, can you please help me with 2D, 3, and 4. Thank you. 1. Sketch a graph of the data, listing the year along the horizontal axis and the sunspot number along the vertical axis. What trigonometric function does this graph resemble? 2. Assume that the data is modeled by an equation of the form y = k + A sin(B(x − h)) or y = k + A cos(B(x − h)). Using the data and your graph from part one, estimate the following variables and explain your answers for each part. (a) Calculate the amplitude as an average of 3 different values. (b) Estimate the period and determine B. (c) Estimate k as an average. (d) Estimate h. 3. Write a model for the data in the form of either y = k + A sin(B(x − h)) or y = k + A cos(B(x − h)). 4. Plot your model from number 4 with the year listed along the horizontal axis and the sunspot number along the vertical axis. How does this compare to the graph of the actual data? 5. According to your model, what is the length of the sunspot cycle in years? Explain? 6. Use your model to predict the sunspot number for 2001. How does your prediction compare with the actual value of 111.


Hello, can you please help me with 2D, 3, and 4. Thank you.
1. Sketch a graph of the data, listing the year along the horizontal axis and the sunspot number along the vertical axis. What trigonometric function does this graph resemble?
2. Assume that the data is modeled by an equation of the form y = k + A sin(B(x − h)) or y = k + A cos(B(x − h)). Using the data and your graph from part one, estimate the following variables and explain your answers for each part.
(a) Calculate the amplitude as an average of 3 different values.
(b) Estimate the period and determine B.
(c) Estimate k as an average.
(d) Estimate h.
3. Write a model for the data in the form of either y = k + A sin(B(x − h)) or y = k + A cos(B(x − h)).
4. Plot your model from number 4 with the year listed along the horizontal axis and the sunspot number along the vertical axis. How does this compare to the graph of the actual data?
5. According to your model, what is the length of the sunspot cycle in years? Explain?
6. Use your model to predict the sunspot number for 2001. How does your prediction compare with the actual value of 111.


Trending now
This is a popular solution!

Step by step
Solved in 2 steps with 2 images


