Questions Exercise 14.18 Algo (Coefficient of Determination) 1 2. 3. 4. 5. 6. O ● ● ● a. Compute SST, SSR, and SSE (to 3 decimals). The following data show the brand, price ($), and the overall score for six stereo headphones that were tested by Consumer Reports (Consumer Reports website). The overall score is based on sound quality and effectiveness of ambient noise reduction. Scores range from 0 (lowest) to 100 (highest). The estimated regression equation for these data is = 23.2642 +0.3174z, where z = price ($) and y = overall score. Brand Bose Scullcandy SST => SSR= Koss هر Phillips/O'Neill Denon JVC SSE = b. Compute the coefficient of determination 2 (to 3 decimals). Price ($) 170 160 85 70 60 55 Score 0 75 7 1 6 40 26 72 61 Question 3 of 6 > 56 4 Check My Work 72 = Comment on the goodness of fit. Hint: If r² is greater than 0.70, the estimated regression equation provides a good fit. The least squares line - Select your answer a good fit as Select your answer-proportion of the variability in y has been explained by the least squares line. c. What is the value of the sample correlation coefficient (to 3 decimals)? Txy ==
Questions Exercise 14.18 Algo (Coefficient of Determination) 1 2. 3. 4. 5. 6. O ● ● ● a. Compute SST, SSR, and SSE (to 3 decimals). The following data show the brand, price ($), and the overall score for six stereo headphones that were tested by Consumer Reports (Consumer Reports website). The overall score is based on sound quality and effectiveness of ambient noise reduction. Scores range from 0 (lowest) to 100 (highest). The estimated regression equation for these data is = 23.2642 +0.3174z, where z = price ($) and y = overall score. Brand Bose Scullcandy SST => SSR= Koss هر Phillips/O'Neill Denon JVC SSE = b. Compute the coefficient of determination 2 (to 3 decimals). Price ($) 170 160 85 70 60 55 Score 0 75 7 1 6 40 26 72 61 Question 3 of 6 > 56 4 Check My Work 72 = Comment on the goodness of fit. Hint: If r² is greater than 0.70, the estimated regression equation provides a good fit. The least squares line - Select your answer a good fit as Select your answer-proportion of the variability in y has been explained by the least squares line. c. What is the value of the sample correlation coefficient (to 3 decimals)? Txy ==
Functions and Change: A Modeling Approach to College Algebra (MindTap Course List)
6th Edition
ISBN:9781337111348
Author:Bruce Crauder, Benny Evans, Alan Noell
Publisher:Bruce Crauder, Benny Evans, Alan Noell
Chapter5: A Survey Of Other Common Functions
Section5.3: Modeling Data With Power Functions
Problem 6E: Urban Travel Times Population of cities and driving times are related, as shown in the accompanying...
Related questions
Question
I really need to learn how to solve each question using the TI-84 Plus CE calculator
Thank you so much!!

Transcribed Image Text:hapter 14 Homework
Questions Exercise 14.18 Algo (Coefficient of Determination)
1.
2.
3.
4.
5.
6.
a. Compute SST, SSR, and SSE (to 3 decimals).
The following data show the brand, price ($), and the overall score for six stereo headphones that were tested by Consumer Reports (Consumer Reports website). The
overall score is based on sound quality and effectiveness of ambient noise reduction. Scores range from 0 (lowest) to 100 (highest). The estimated regression equation for
these data is = 23.2642 +0.3174x, where x = price ($) and y = overall score.
SST =
Brand
Bose
Scullcandy
Koss
Phillips/O'Neill
Txy
Denon
JVC
SSR =
SSE =
b. Compute the coefficient of determination 2 (to 3 decimals).
2
Price ($)
170
160
85
70
60
55
Score
75
72
61
56
40
26
4 Question 3 of 6 ►
W
Check My Work
Comment on the goodness of fit. Hint: If 2 is greater than 0.70, the estimated regression equation provides a good fit.
The least squares line Select your answer - ✓a good fit as - Select your answer- proportion of the variability in y has been explained by the least squares line.
c. What is the value of the sample correlation coefficient (to 3 decimals)?
Check My Work
Expert Solution
This question has been solved!
Explore an expertly crafted, step-by-step solution for a thorough understanding of key concepts.
This is a popular solution!
Trending now
This is a popular solution!
Step by step
Solved in 5 steps with 2 images

Follow-up Questions
Read through expert solutions to related follow-up questions below.
Follow-up Question
Hello,
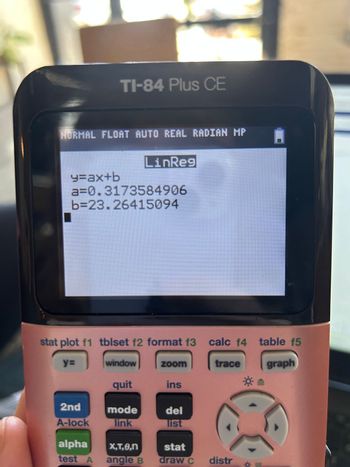
For some reason, my screen looks like this:
Could you help me trouble shoot?

Transcribed Image Text:NORMAL FLOAT AUTO REAL RADIAN MP
y=ax+b
TI-84 Plus CE
a=0.3173584906
b=23.26415094
2nd
A-lock
stat plot f1 tblset f2 format f3 calc f4 table f5
y=
window
graph
quit
LinReg
mode
link
alpha
X,T, 0,n
test A angle B
zoom
ins
del
list
stat
draw c
trace
distr
-=
=
Solution
Recommended textbooks for you

Functions and Change: A Modeling Approach to Coll…
Algebra
ISBN:
9781337111348
Author:
Bruce Crauder, Benny Evans, Alan Noell
Publisher:
Cengage Learning

Linear Algebra: A Modern Introduction
Algebra
ISBN:
9781285463247
Author:
David Poole
Publisher:
Cengage Learning

Algebra & Trigonometry with Analytic Geometry
Algebra
ISBN:
9781133382119
Author:
Swokowski
Publisher:
Cengage

Functions and Change: A Modeling Approach to Coll…
Algebra
ISBN:
9781337111348
Author:
Bruce Crauder, Benny Evans, Alan Noell
Publisher:
Cengage Learning

Linear Algebra: A Modern Introduction
Algebra
ISBN:
9781285463247
Author:
David Poole
Publisher:
Cengage Learning

Algebra & Trigonometry with Analytic Geometry
Algebra
ISBN:
9781133382119
Author:
Swokowski
Publisher:
Cengage

Glencoe Algebra 1, Student Edition, 9780079039897…
Algebra
ISBN:
9780079039897
Author:
Carter
Publisher:
McGraw Hill