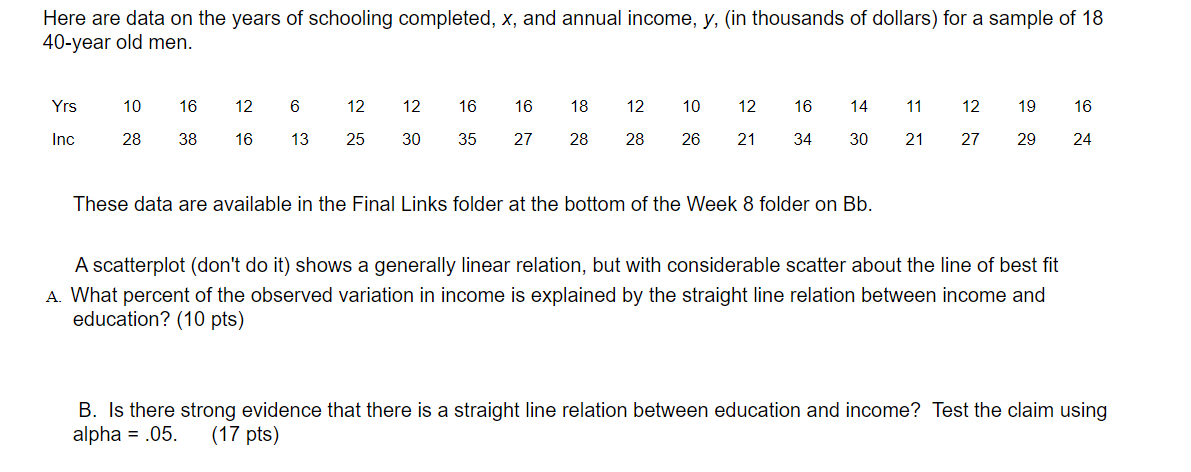
Here are data on the years of schooling completed, x, and annual income, y, (in thousands of dollars) for a sample of 18 40-year old men. Yrs 10 16 12 6 12 12 16 16 18 12 10 12 16 14 11 12 19 16 Inc 28 38 16 13 25 30 35 27 28 28 26 21 34 30 21 27 29 24 These data are available in the Final Links folder at the bottom of the Week 8 folder on Bb. A scatterplot (don't do it) shows a generally linear relation, but with considerable scatter about the line of best fit A. What percent of the observed variation in income is explained by the straight line relation between income and education? (10 pts) B. Is there strong evidence that there is a straight line relation between education and income? Test the claim using alpha = .05. (17 pts)
Here are data on the years of schooling completed, x, and annual income, y, (in thousands of dollars) for a sample of 18 40-year old men. Yrs 10 16 12 6 12 12 16 16 18 12 10 12 16 14 11 12 19 16 Inc 28 38 16 13 25 30 35 27 28 28 26 21 34 30 21 27 29 24 These data are available in the Final Links folder at the bottom of the Week 8 folder on Bb. A scatterplot (don't do it) shows a generally linear relation, but with considerable scatter about the line of best fit A. What percent of the observed variation in income is explained by the straight line relation between income and education? (10 pts) B. Is there strong evidence that there is a straight line relation between education and income? Test the claim using alpha = .05. (17 pts)

Functions and Change: A Modeling Approach to College Algebra (MindTap Course List)
6th Edition
ISBN:9781337111348
Author:Bruce Crauder, Benny Evans, Alan Noell
Publisher:Bruce Crauder, Benny Evans, Alan Noell
Chapter5: A Survey Of Other Common Functions
Section5.3: Modeling Data With Power Functions
Problem 6E: Urban Travel Times Population of cities and driving times are related, as shown in the accompanying...

Related questions
Question
please answer this question step by step.
Transcribed Image Text:Here are data on the years of schooling completed, x, and annual income, y, (in thousands of dollars) for a sample of 18
40-year old men.
Yrs
10
16
12
6
12
12
16
16
18
12
10
12
16
14
11
12
19
16
Inc
28
38
16
13
25
30
35
27
28
28
26
21
34
30
21
27
29
24
These data are available in the Final Links folder at the bottom of the Week 8 folder on Bb.
A scatterplot (don't do it) shows a generally linear relation, but with considerable scatter about the line of best fit
A. What percent of the observed variation in income is explained by the straight line relation between income and
education? (10 pts)
B. Is there strong evidence that there is a straight line relation between education and income? Test the claim using
alpha = .05.
(17 pts)
Expert Solution
This question has been solved!
Explore an expertly crafted, step-by-step solution for a thorough understanding of key concepts.

This is a popular solution!

Trending now
This is a popular solution!

Step by step
Solved in 2 steps with 2 images

Recommended textbooks for you
Functions and Change: A Modeling Approach to Coll…
Algebra
ISBN:
9781337111348
Author:
Bruce Crauder, Benny Evans, Alan Noell
Publisher:
Cengage Learning
Functions and Change: A Modeling Approach to Coll…
Algebra
ISBN:
9781337111348
Author:
Bruce Crauder, Benny Evans, Alan Noell
Publisher:
Cengage Learning