Here are summary statistics for randomly selected weights of newborn girls: n = 234, x= 33.7 hg, s=7.9 hg. Construct a confidence interval estimate of the mean. Use a 90% confidence level. Are these results very different from the confidence interval 31.8 hg < µ< 35.4 hg with only 13 sample values, x = 33.6 hg, and s = 3.7 hg? What is the confidence interval for the population mean µ? hg <µ< hg (Round to one decimal place as needed.) Are the results between the two confidence intervals very different? O A. Yes, because the confidence interval limits are not similar. O B. Yes, because one confidence interval does not contain the mean of the other confidence interval. O C. No, because the confidence interval limits are similar. O D. No, because each confidence interval contains the mean of the other confidence interval.
Here are summary statistics for randomly selected weights of newborn girls: n = 234, x= 33.7 hg, s=7.9 hg. Construct a confidence interval estimate of the mean. Use a 90% confidence level. Are these results very different from the confidence interval 31.8 hg < µ< 35.4 hg with only 13 sample values, x = 33.6 hg, and s = 3.7 hg? What is the confidence interval for the population mean µ? hg <µ< hg (Round to one decimal place as needed.) Are the results between the two confidence intervals very different? O A. Yes, because the confidence interval limits are not similar. O B. Yes, because one confidence interval does not contain the mean of the other confidence interval. O C. No, because the confidence interval limits are similar. O D. No, because each confidence interval contains the mean of the other confidence interval.

Glencoe Algebra 1, Student Edition, 9780079039897, 0079039898, 2018
18th Edition
ISBN:9780079039897
Author:Carter
Publisher:Carter
Chapter10: Statistics
Section10.4: Distributions Of Data
Problem 19PFA

Related questions

Question
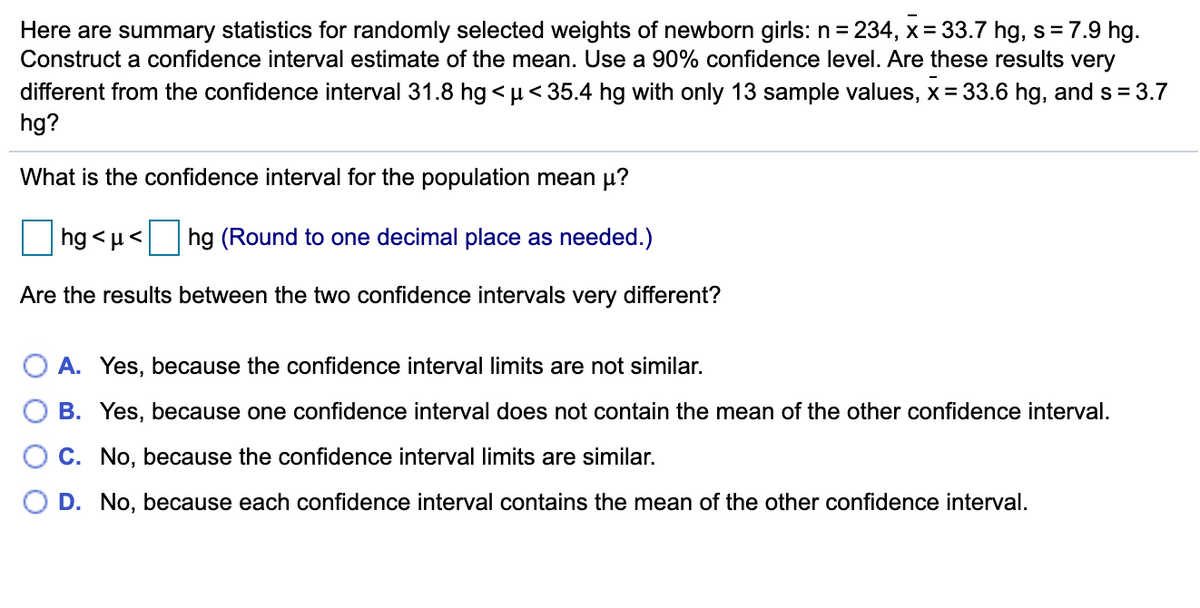
Transcribed Image Text:Here are summary statistics for randomly selected weights of newborn girls: n = 234, x = 33.7 hg, s= 7.9 hg.
Construct a confidence interval estimate of the mean. Use a 90% confidence level. Are these results very
different from the confidence interval 31.8 hg <µ< 35.4 hg with only 13 sample values, x = 33.6 hg, and s = 3.7
hg?
What is the confidence interval for the population mean µ?
hg < µ< hg (Round to one decimal place as needed.)
Are the results between the two confidence intervals very different?
A. Yes, because the confidence interval limits are not similar.
O B. Yes, because one confidence interval does not contain the mean of the other confidence interval.
C. No, because the confidence interval limits are similar.
D. No, because each confidence interval contains the mean of the other confidence interval.
Expert Solution
This question has been solved!
Explore an expertly crafted, step-by-step solution for a thorough understanding of key concepts.

This is a popular solution!

Trending now
This is a popular solution!

Step by step
Solved in 2 steps

Knowledge Booster


Learn more about
Need a deep-dive on the concept behind this application? Look no further. Learn more about this topic, statistics and related others by exploring similar questions and additional content below.Recommended textbooks for you
Glencoe Algebra 1, Student Edition, 9780079039897…
Algebra
ISBN:
9780079039897
Author:
Carter
Publisher:
McGraw Hill
Glencoe Algebra 1, Student Edition, 9780079039897…
Algebra
ISBN:
9780079039897
Author:
Carter
Publisher:
McGraw Hill