Here is a frequency distribution table (FDT) for a small data set: data value frequency 15 21 16 25 17 12 18 28 19 23 Find the following measures of central tendency. mean (7) = (Please show your answer to one decimal place. median = (Please enter an exact answer.) %3D mode = (Please enter an exact answer.)
Here is a frequency distribution table (FDT) for a small data set: data value frequency 15 21 16 25 17 12 18 28 19 23 Find the following measures of central tendency. mean (7) = (Please show your answer to one decimal place. median = (Please enter an exact answer.) %3D mode = (Please enter an exact answer.)

Glencoe Algebra 1, Student Edition, 9780079039897, 0079039898, 2018
18th Edition
ISBN:9780079039897
Author:Carter
Publisher:Carter
Chapter10: Statistics
Section: Chapter Questions
Problem 25SGR

Related questions
Question
What is the mean , median and mode ?
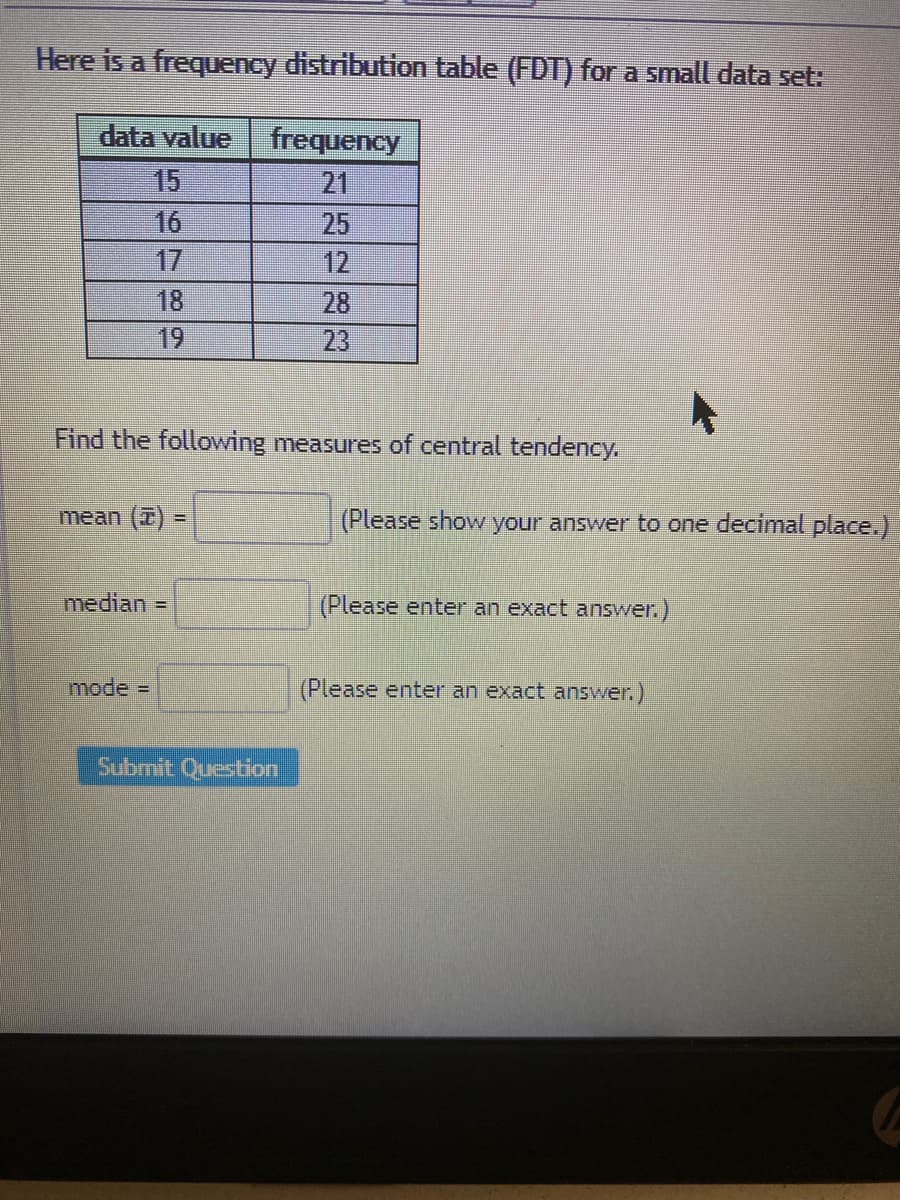
Transcribed Image Text:Here is a frequency distribution table (FDT) for a small data set:
data value frequency
15
16
17
21
25
12
28
18
19
23
Find the following measures of central tendency.
mean (7)
(Please show your answer to one decimal place.)
median =
(Please enter an exact answer.)
mode =
(Please enter an exact answer.)
Submit Question
Expert Solution
This question has been solved!
Explore an expertly crafted, step-by-step solution for a thorough understanding of key concepts.

This is a popular solution!

Trending now
This is a popular solution!

Step by step
Solved in 2 steps with 1 images

Recommended textbooks for you
Glencoe Algebra 1, Student Edition, 9780079039897…
Algebra
ISBN:
9780079039897
Author:
Carter
Publisher:
McGraw Hill
Glencoe Algebra 1, Student Edition, 9780079039897…
Algebra
ISBN:
9780079039897
Author:
Carter
Publisher:
McGraw Hill