The table below displays the (mean) maximum July temperature measured over ten years at the Armagh weather station. maximum July temperature / °C year 1992 18.9 1993 17.4 1994 19.5 1995 21.2 1996 19.2 1997 19.5 1998 17.9 1999 20.7 2000 20.1 2001 19.4 Source: www.met-office.gov.uk Find the sample mean, median, standard deviation, and skewness. Draw a stem-and-leaf diagram for the data, using a double-digit stem.
The table below displays the (mean) maximum July temperature measured over ten years at the Armagh weather station. maximum July temperature / °C year 1992 18.9 1993 17.4 1994 19.5 1995 21.2 1996 19.2 1997 19.5 1998 17.9 1999 20.7 2000 20.1 2001 19.4 Source: www.met-office.gov.uk Find the sample mean, median, standard deviation, and skewness. Draw a stem-and-leaf diagram for the data, using a double-digit stem.

Mathematics For Machine Technology
8th Edition
ISBN:9781337798310
Author:Peterson, John.
Publisher:Peterson, John.
Chapter29: Tolerance, Clearance, And Interference
Section: Chapter Questions
Problem 16A: Spacers are manufactured to the mean dimension and tolerance shown in Figure 29-12. An inspector...

Related questions
Question
please find skewness, sample standard deviation and stem leaf diagram
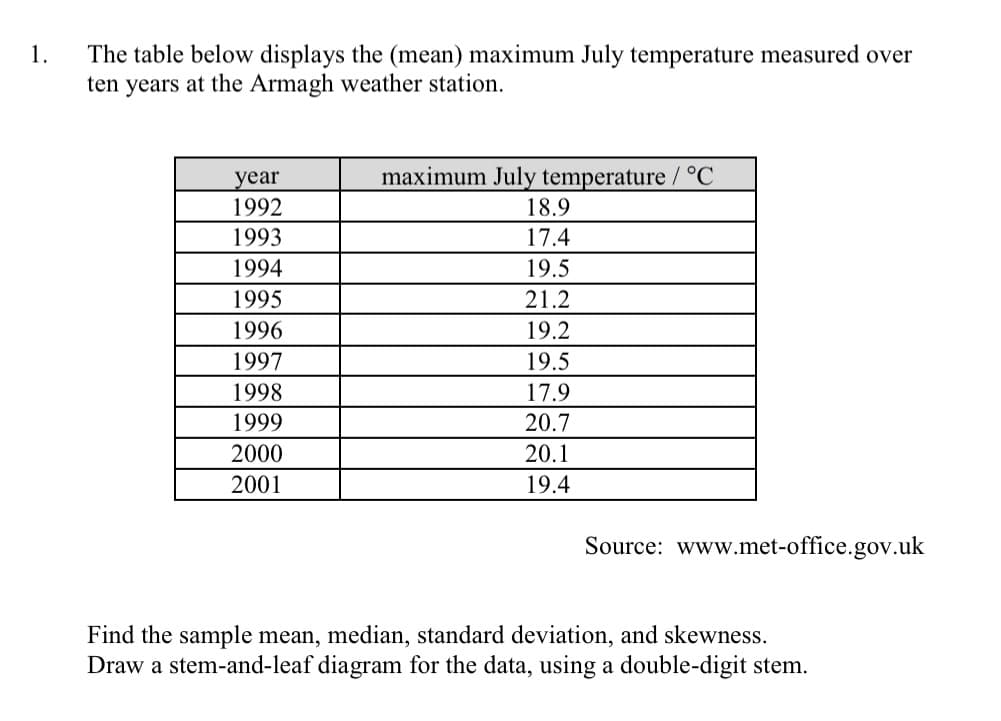
Transcribed Image Text:The table below displays the (mean) maximum July temperature measured over
ten years at the Armagh weather station.
1.
year
maximum July temperature/ °C
1992
18.9
1993
17.4
1994
19.5
1995
21.2
1996
19.2
1997
19.5
1998
17.9
1999
20.7
2000
20.1
2001
19.4
Source: www.met-office.gov.uk
Find the sample mean, median, standard deviation, and skewness.
Draw a stem-and-leaf diagram for the data, using a double-digit stem.
Expert Solution
This question has been solved!
Explore an expertly crafted, step-by-step solution for a thorough understanding of key concepts.

Step by step
Solved in 3 steps with 3 images

Recommended textbooks for you
Mathematics For Machine Technology
Advanced Math
ISBN:
9781337798310
Author:
Peterson, John.
Publisher:
Cengage Learning,

Glencoe Algebra 1, Student Edition, 9780079039897…
Algebra
ISBN:
9780079039897
Author:
Carter
Publisher:
McGraw Hill
Mathematics For Machine Technology
Advanced Math
ISBN:
9781337798310
Author:
Peterson, John.
Publisher:
Cengage Learning,
Glencoe Algebra 1, Student Edition, 9780079039897…
Algebra
ISBN:
9780079039897
Author:
Carter
Publisher:
McGraw Hill