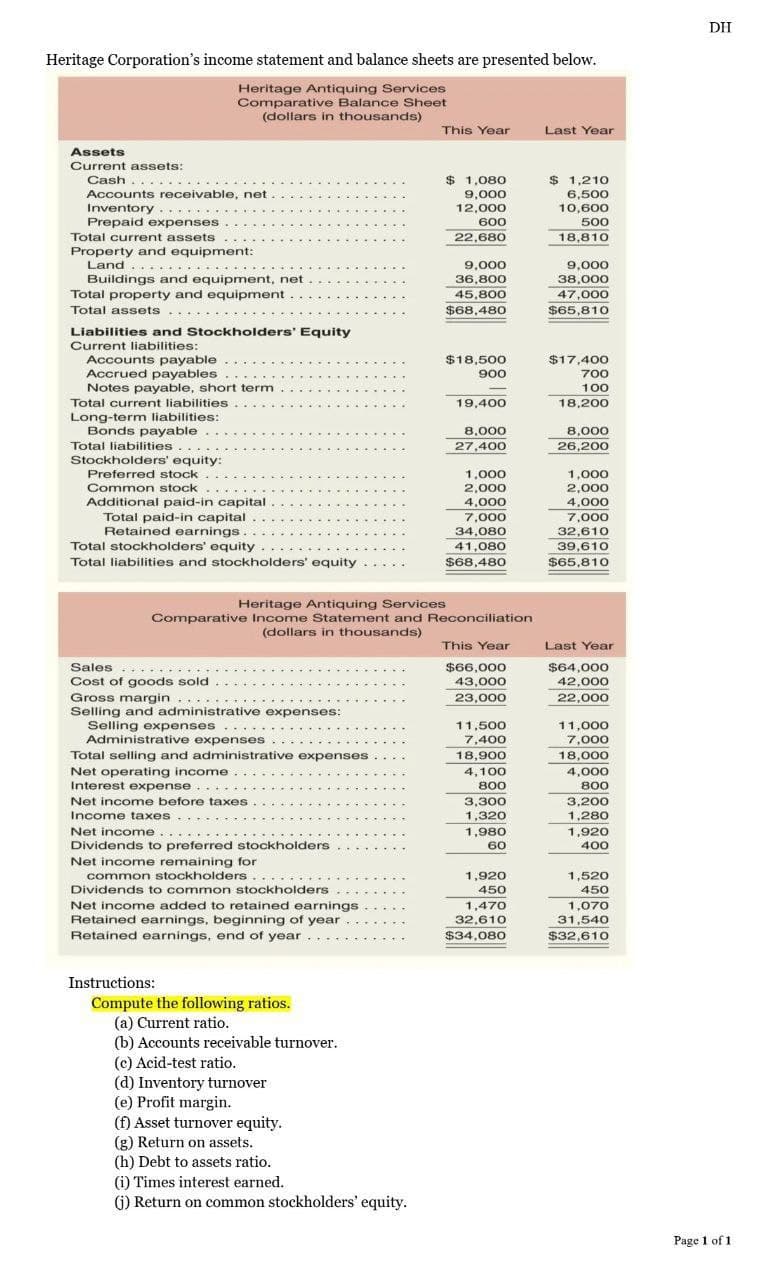
Heritage Corporation's income statement and balance sheets are presented below. Heritage Antiquing Services Comparative Balance Sheet (dollars in thousands) Assets Current assets: Cash..... Accounts receivable, net Inventory......... Prepaid expenses Total current assets Property and equipment: Land ....... Buildings and equipment, net Total property and equipment Total assets Liabilities and Stockholders' Equity Current liabilities: Accounts payable Accrued payables Notes payable, short term Total current liabilities. Long-term liabilities: Bonds payable Total liabilities. Stockholders' equity: Preferred stock. Common stock Additional paid-in capital Total paid-in capital. Retained earnings. Total stockholders' equity Total liabilities and stockholders' equity Sales... Cost of goods sold Gross margin Selling and administrative expenses: Selling expenses .. Administrative expenses Total selling and administrative expenses Net operating income Interest expense Net income before taxes Income taxes. Net income . Instructions: ......... Dividends to preferred stockholders Net income remaining for common stockholders........ Dividends to common stockholders Net income added to retained earnings Retained earnings, beginning of year Retained earnings, end of year Heritage Antiquing Services Comparative Income Statement and Reconciliation (dollars in thousands) Compute the following ratios. (a) Current ratio. (b) Accounts receivable turnover. (c) Acid-test ratio. (d) Inventory turnover (e) Profit margin. (f) Asset turnover equity. (g) Return on assets. (h) Debt to assets ratio. This Year (i) Times interest earned. (j) Return on common stockholders' equity. $ 1,080 9,000 12,000 600 22,680 9,000 36,800 45,800 $68,480 $18,500 900 19,400 8,000 27,400 1,000 2,000 4,000 7,000 34,080 41,080 $68,480 This Year $66,000 43,000 23,000 11,500 7,400 18,900 4,100 800 3,300 1,320 1,980 60 1,920 450 1,470 32,610 $34,080 Last Year $1,210 6,500 10,600 500 18,810 9,000 38,000 47,000 $65,810 $17,400 700 100 18,200 8,000 26,200 1,000 2,000 4,000 7,000 32,610 39,610 $65,810 Last Year $64,000 42,000 22,000 11,000 7,000 18,000 4,000 800 3,200 1,280 1,920 400 1,520 450 1,070 31,540 $32,610 DH Page 1 of 1.
Heritage Corporation's income statement and balance sheets are presented below. Heritage Antiquing Services Comparative Balance Sheet (dollars in thousands) Assets Current assets: Cash..... Accounts receivable, net Inventory......... Prepaid expenses Total current assets Property and equipment: Land ....... Buildings and equipment, net Total property and equipment Total assets Liabilities and Stockholders' Equity Current liabilities: Accounts payable Accrued payables Notes payable, short term Total current liabilities. Long-term liabilities: Bonds payable Total liabilities. Stockholders' equity: Preferred stock. Common stock Additional paid-in capital Total paid-in capital. Retained earnings. Total stockholders' equity Total liabilities and stockholders' equity Sales... Cost of goods sold Gross margin Selling and administrative expenses: Selling expenses .. Administrative expenses Total selling and administrative expenses Net operating income Interest expense Net income before taxes Income taxes. Net income . Instructions: ......... Dividends to preferred stockholders Net income remaining for common stockholders........ Dividends to common stockholders Net income added to retained earnings Retained earnings, beginning of year Retained earnings, end of year Heritage Antiquing Services Comparative Income Statement and Reconciliation (dollars in thousands) Compute the following ratios. (a) Current ratio. (b) Accounts receivable turnover. (c) Acid-test ratio. (d) Inventory turnover (e) Profit margin. (f) Asset turnover equity. (g) Return on assets. (h) Debt to assets ratio. This Year (i) Times interest earned. (j) Return on common stockholders' equity. $ 1,080 9,000 12,000 600 22,680 9,000 36,800 45,800 $68,480 $18,500 900 19,400 8,000 27,400 1,000 2,000 4,000 7,000 34,080 41,080 $68,480 This Year $66,000 43,000 23,000 11,500 7,400 18,900 4,100 800 3,300 1,320 1,980 60 1,920 450 1,470 32,610 $34,080 Last Year $1,210 6,500 10,600 500 18,810 9,000 38,000 47,000 $65,810 $17,400 700 100 18,200 8,000 26,200 1,000 2,000 4,000 7,000 32,610 39,610 $65,810 Last Year $64,000 42,000 22,000 11,000 7,000 18,000 4,000 800 3,200 1,280 1,920 400 1,520 450 1,070 31,540 $32,610 DH Page 1 of 1.

Cornerstones of Financial Accounting
4th Edition
ISBN:9781337690881
Author:Jay Rich, Jeff Jones
Publisher:Jay Rich, Jeff Jones
Chapter11: The Statement Of Cash Flows
Section: Chapter Questions
Problem 35E: Classification of Cash Flows The following are several items that might be disclosed on a companys...

Related questions

Question
Transcribed Image Text:Heritage Corporation's income statement and balance sheets are presented below.
Heritage Antiquing Services
Comparative Balance Sheet
(dollars in thousands)
Assets
Current assets:
Cash.....
Accounts receivable, net
Inventory.........
Prepaid expenses
Total current assets
Property and equipment:
Land
..…....
Buildings and equipment, net
Total property and equipment
Total assets
Liabilities and Stockholders' Equity
Current liabilities:
Accounts payable
Accrued payables
Notes payable, short term
Total current liabilities.
Long-term liabilities:
Bonds payable
Total liabilities.
Stockholders' equity:
Preferred stock.
Common stock
Additional paid-in capital
Total paid-in capital.
Retained earnings.
Total stockholders' equity
Total liabilities and stockholders' equity
Sales...
Cost of goods sold
Gross margin
Selling and administrative expenses:
Selling expenses..
Administrative expenses
Total selling and administrative expenses
Net operating income
Interest expense
Net income before taxes
Income taxes.
Net income
.
Dividends to preferred stockholders
Net income remaining for
common stockholders........
Dividends to common stockholders
Net income added to retained earnings
Retained earnings, beginning of year
Retained earnings, end of year
Instructions:
Heritage Antiquing Services
Comparative Income Statement and Reconciliation
(dollars in thousands)
Compute the following ratios.
(a) Current ratio.
(b) Accounts receivable turnover.
(c) Acid-test ratio.
(d) Inventory turnover
(e) Profit margin.
(f) Asset turnover equity.
(g) Return on assets.
(h) Debt to assets ratio.
This Year
(i) Times interest earned.
(j) Return on common stockholders' equity.
$ 1,080
9,000
12,000
600
22,680
9,000
36,800
45,800
$68,480
$18,500
900
19,400
8,000
27,400
1,000
2,000
4,000
7,000
34,080
41,080
$68,480
This Year
$66,000
43,000
23,000
11,500
7,400
18,900
4,100
800
3,300
1,320
1,980
60
1,920
450
1,470
32,610
$34,080
Last Year
$1,210
6,500
10,600
500
18,810
9,000
38,000
47,000
$65,810
$17,400
700
100
18,200
8,000
26,200
1,000
2,000
4,000
7,000
32,610
39,610
$65,810
Last Year
$64,000
42,000
22,000
11,000
7,000
18,000
4,000
800
3,200
1,280
1,920
400
1,520
450
1,070
31,540
$32,610
DH
Page 1 of 1.
Expert Solution
This question has been solved!
Explore an expertly crafted, step-by-step solution for a thorough understanding of key concepts.

Step by step
Solved in 3 steps

Knowledge Booster


Learn more about
Need a deep-dive on the concept behind this application? Look no further. Learn more about this topic, accounting and related others by exploring similar questions and additional content below.Recommended textbooks for you
Cornerstones of Financial Accounting
Accounting
ISBN:
9781337690881
Author:
Jay Rich, Jeff Jones
Publisher:
Cengage Learning


Financial Accounting: The Impact on Decision Make…
Accounting
ISBN:
9781305654174
Author:
Gary A. Porter, Curtis L. Norton
Publisher:
Cengage Learning
Cornerstones of Financial Accounting
Accounting
ISBN:
9781337690881
Author:
Jay Rich, Jeff Jones
Publisher:
Cengage Learning
Financial Accounting: The Impact on Decision Make…
Accounting
ISBN:
9781305654174
Author:
Gary A. Porter, Curtis L. Norton
Publisher:
Cengage Learning

Financial Accounting
Accounting
ISBN:
9781337272124
Author:
Carl Warren, James M. Reeve, Jonathan Duchac
Publisher:
Cengage Learning

Managerial Accounting
Accounting
ISBN:
9781337912020
Author:
Carl Warren, Ph.d. Cma William B. Tayler
Publisher:
South-Western College Pub

Century 21 Accounting Multicolumn Journal
Accounting
ISBN:
9781337679503
Author:
Gilbertson
Publisher:
Cengage