Histogram: Histogram of length 8 7 6. 2 1 2 3 5 6 7 8 9. length Frequency 9,

Glencoe Algebra 1, Student Edition, 9780079039897, 0079039898, 2018
18th Edition
ISBN:9780079039897
Author:Carter
Publisher:Carter
Chapter10: Statistics
Section10.1: Measures Of Center
Problem 25PFA

Related questions
Question

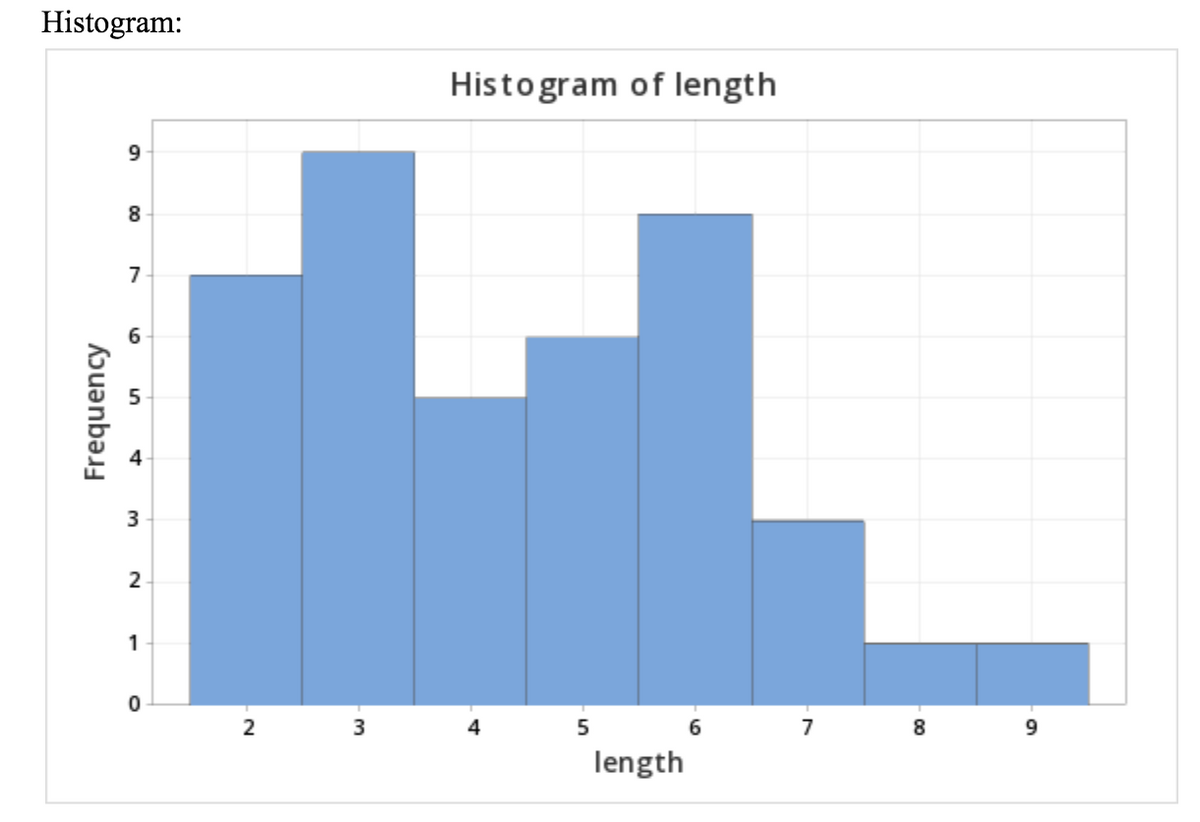
Transcribed Image Text:7. Describe the shape of your data set by looking at the histogram. In your histogram
how many classes are there? What is the class width?
Transcribed Image Text:Histogram:
Histogram of length
9
8
7
6
3
2
1
2
5
7
8
length
Frequency
Expert Solution
Step 1
Given: data:
Histogram of length is shown in graph
X shows length and y shows frequency
We have to describe the shape of the histogram.

Trending now
This is a popular solution!

Step by step
Solved in 2 steps with 1 images

Recommended textbooks for you
Glencoe Algebra 1, Student Edition, 9780079039897…
Algebra
ISBN:
9780079039897
Author:
Carter
Publisher:
McGraw Hill

Holt Mcdougal Larson Pre-algebra: Student Edition…
Algebra
ISBN:
9780547587776
Author:
HOLT MCDOUGAL
Publisher:
HOLT MCDOUGAL
Glencoe Algebra 1, Student Edition, 9780079039897…
Algebra
ISBN:
9780079039897
Author:
Carter
Publisher:
McGraw Hill
Holt Mcdougal Larson Pre-algebra: Student Edition…
Algebra
ISBN:
9780547587776
Author:
HOLT MCDOUGAL
Publisher:
HOLT MCDOUGAL