Histogram of Scores N: 30; Min: 50; Mean: 73.167; Max: 93 12 10 50 60 By looking at the histogram, what can you conclude about the nature of the distribution? Is it normally distributed? 70 Scores 90 100 Aauanbay
Histogram of Scores N: 30; Min: 50; Mean: 73.167; Max: 93 12 10 50 60 By looking at the histogram, what can you conclude about the nature of the distribution? Is it normally distributed? 70 Scores 90 100 Aauanbay

Glencoe Algebra 1, Student Edition, 9780079039897, 0079039898, 2018
18th Edition
ISBN:9780079039897
Author:Carter
Publisher:Carter
Chapter10: Statistics
Section: Chapter Questions
Problem 22SGR

Related questions
Question
quality control
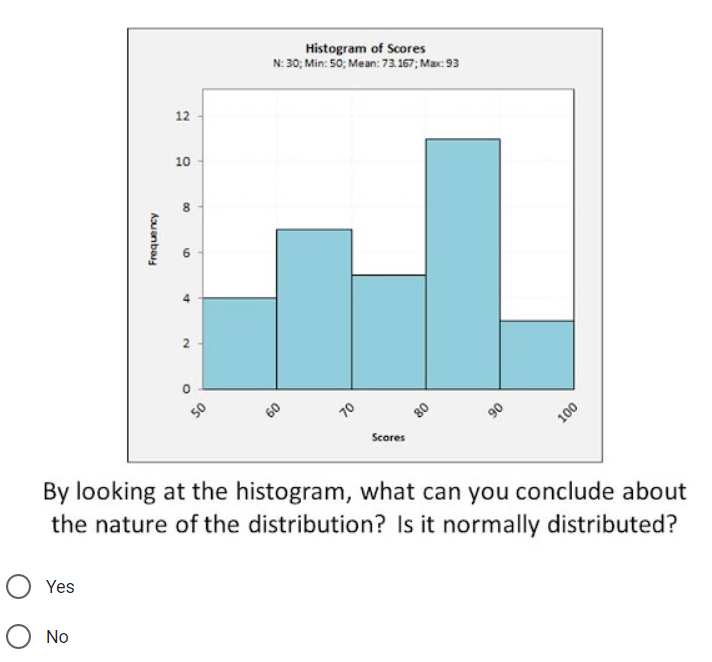
Transcribed Image Text:Histogram of Scores
N: 30; Min: 50; Mean: 73.167; Max: 93
12
10
50
60
By looking at the histogram, what can you conclude about
the nature of the distribution? Is it normally distributed?
70
80
Scores
90
100
O Yes
No
2.
Aauanbay
Expert Solution
This question has been solved!
Explore an expertly crafted, step-by-step solution for a thorough understanding of key concepts.

Step by step
Solved in 2 steps

Recommended textbooks for you
Glencoe Algebra 1, Student Edition, 9780079039897…
Algebra
ISBN:
9780079039897
Author:
Carter
Publisher:
McGraw Hill
Glencoe Algebra 1, Student Edition, 9780079039897…
Algebra
ISBN:
9780079039897
Author:
Carter
Publisher:
McGraw Hill