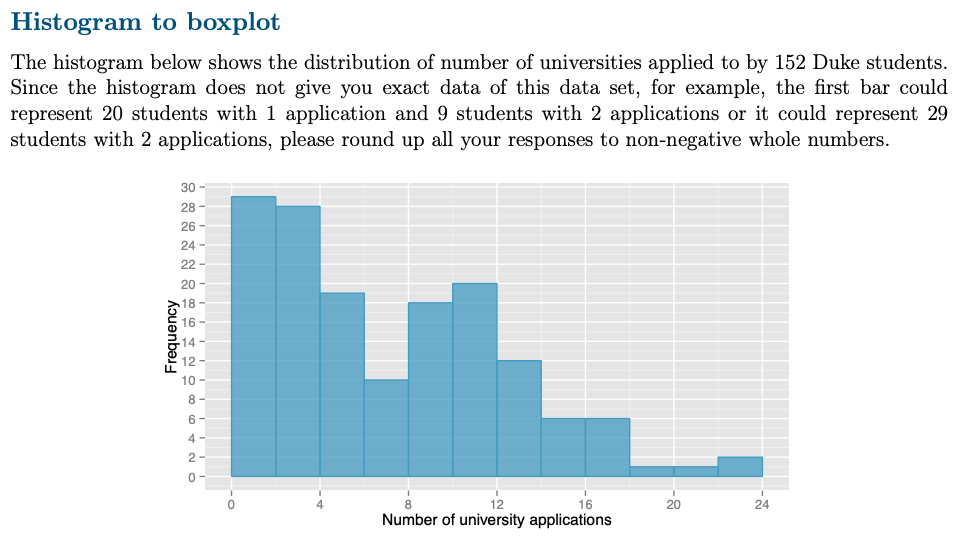
Histogram to boxplot The histogram below shows the distribution of number of universities applied to by 152 Duke students. Since the histogram does not give you exact data of this data set, for example, the first bar could represent 20 students with 1 application and 9 students with 2 applications or it could represent 29 students with 2 applications, please round up all your responses to non-negative whole numbers. Frequency 30 28 26 24 22 166 20 18- 16 14- 12 10- 8- 6- 4- 2- ON 0- 12 16 Number of university applications 20 24
Histogram to boxplot The histogram below shows the distribution of number of universities applied to by 152 Duke students. Since the histogram does not give you exact data of this data set, for example, the first bar could represent 20 students with 1 application and 9 students with 2 applications or it could represent 29 students with 2 applications, please round up all your responses to non-negative whole numbers. Frequency 30 28 26 24 22 166 20 18- 16 14- 12 10- 8- 6- 4- 2- ON 0- 12 16 Number of university applications 20 24

Glencoe Algebra 1, Student Edition, 9780079039897, 0079039898, 2018
18th Edition
ISBN:9780079039897
Author:Carter
Publisher:Carter
Chapter10: Statistics
Section10.5: Comparing Sets Of Data
Problem 26PFA

Related questions
Question
Please help show step by step on how to construct a box plot from a given histogram.
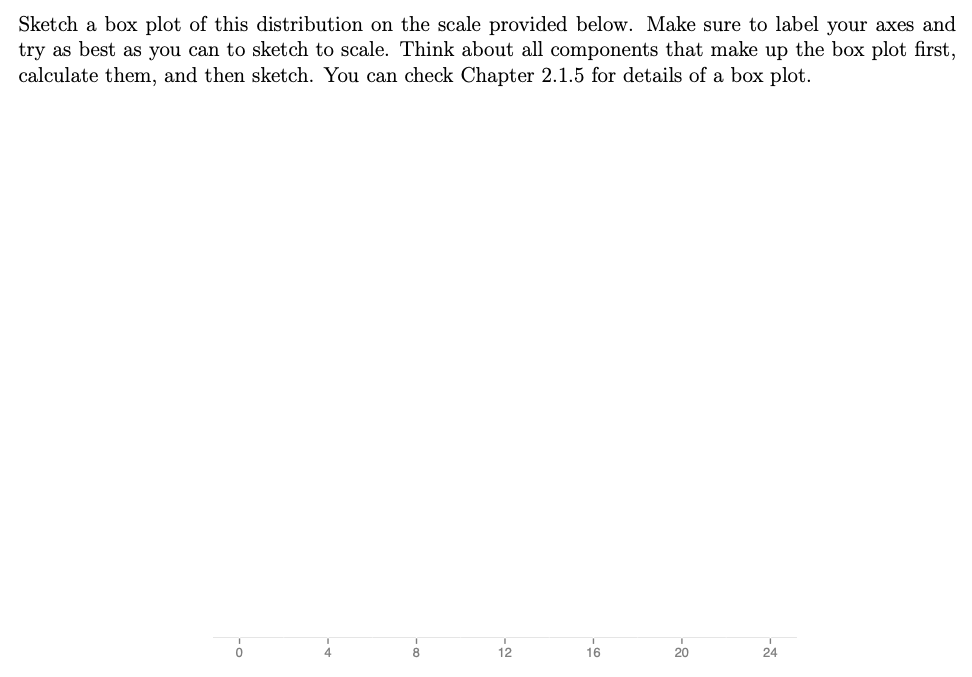
Transcribed Image Text:Sketch a box plot of this distribution on the scale provided below. Make sure to label your axes and
try as best as you can to sketch to scale. Think about all components that make up the box plot first,
calculate them, and then sketch. You can check Chapter 2.1.5 for details of a box plot.
ő
-∞o
12
-60
16
20
24
Transcribed Image Text:Histogram
to boxplot
The histogram below shows the distribution of number of universities applied to by 152 Duke students.
Since the histogram does not give you exact data of this data set, for example, the first bar could
represent 20 students with 1 application and 9 students with 2 applications or it could represent 29
students with 2 applications, please round up all your responses to non-negative whole numbers.
522222
Frequency
30-
28
26-
24-
20
18
16-
14-
12-
10-
8-
6-
4-
2-
12
16
Number of university applications
20
24
Expert Solution
This question has been solved!
Explore an expertly crafted, step-by-step solution for a thorough understanding of key concepts.

This is a popular solution!

Trending now
This is a popular solution!

Step by step
Solved in 4 steps with 2 images

Recommended textbooks for you
Glencoe Algebra 1, Student Edition, 9780079039897…
Algebra
ISBN:
9780079039897
Author:
Carter
Publisher:
McGraw Hill

Glencoe Algebra 1, Student Edition, 9780079039897…
Algebra
ISBN:
9780079039897
Author:
Carter
Publisher:
McGraw Hill