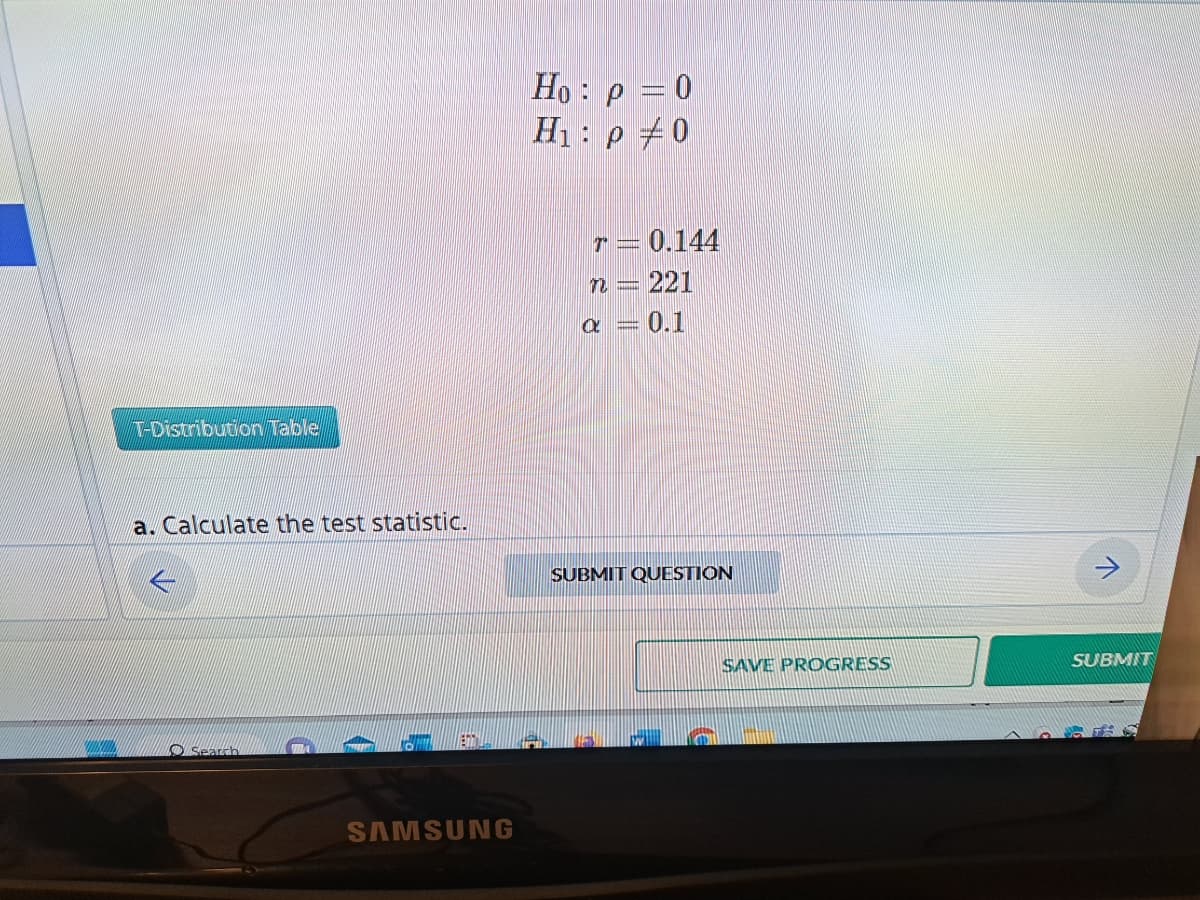
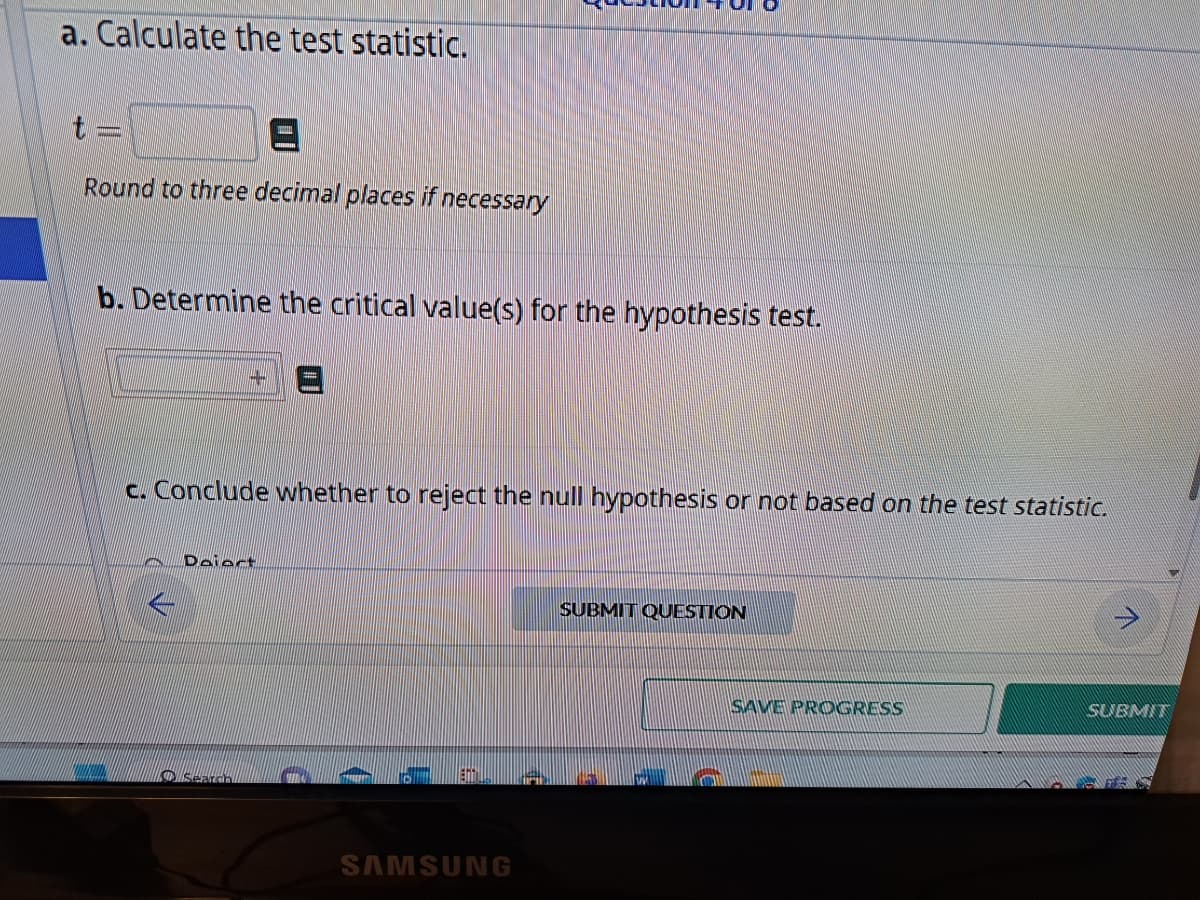
Ho: p = 0 P H₁: p0 T = 0.144 n = 221 a = 0.1


Q: Part 2 Answer the following to summarize the test of the hypothesis that birthdays are equally…
A: Given data : Here , Significance level is not given lets assume it = 0.05 Null And alternative…
Q: A random sample of 21 wolf litters in Ontario, Canada, gave an average of x1 = 4.7 wolf pups per…
A: Confidence interval are range where the true value of population lies. It provide the range for…
Q: An automotive manufacturer wants to know the proportion of new car buyers who prefer foreign cars…
A: Solution-: Given: n=1217,x=267 We want to estimate the proportion of new car buyers who prefer…
Q: R3.35. Age and party 2008 The Pew Research Center collected data from national exits polls conducted…
A: The Pew research center collected data from national exit polls conducted by NBC news after the 2008…
Q: Y Part 1 of A researcher wonders if there an association between the incidence of colds and the…
A: For the given data, we need to test the chi square test.
Q: You may need to use the appropriate technology to answer this question. A regression analysis…
A: It is given that Sample size n = 44 SSE(full) = 36 SSE(reduced) = 43 Number of parameters in full…
Q: What is the Mean Squares due to Treatment (MST)?
A: Step-by-step procedure to obtain the mean squares due to Treatment (MST) using Excel is given below:…
Q: Which of the following is a correct statement? If the null hypothesis is true, there is no…
A: Given in the question: Which of the following is a correct statement ?
Q: The data below show consumption of chicken and its real price at GIMPA Consumption (Y ) 3…
A: viii) Regression Equation is, Y=0.2703+0.2546X The monthly consumption for a student with 10 Ghana…
Q: A random sample of 10 students were surveyed on their social activities. The students were asked to…
A: The data shows the number of times during the previous year they had gone to sporting event or…
Q: Using the t-test formula, what is value?
A:
Q: In a one-way analysis of variance with three groups, the research hypothesis is: Ο μ1 > μ2 and μ3.…
A: Here we have given the multiple choice question about the One way Analysis of Variance i.e. ANOVA.…
Q: It is reported that the time married men with children spend on child care averages 6.6 hours per…
A: From the provided information, Sample size (n) = 40 The claim is that the population mean number of…
Q: Which value represents the variability attributable to the different factor levels or treatments?
A: From the One-Way ANOVA, the variability attributes to the different factor levels or Treatment is…
Q: Please refer to Problem C: What is the expected count for the cell on women and beaches (e3 = ?)?
A: Here we have given the table, using this table we have to find the expected count for the cell on…
Q: What is the regression equation? =+x (Round to three decimal places as needed.)
A:
Q: The best point estimator of the population mean is the sample mode. Answer Choose a match False True
A: The best point estimator of the population mean is "sample mean".
Q: Listed below are the overhead widths (in cm) of seals measured from photographs and the weights of…
A: We have given that Overhead Width (X) Weight (Y) 7.6 146 7.4 112 8.7 184 7.9 240 9.1…
Q: According to a research center, 21% of all merchandise sold in a particular country gets returned. A…
A: Given that Sample size(n)=80 Number of item return (X)= 28 We have to find a..Point estimate b..95%…
Q: In this case the test statistic and p-value are Ot=2.12, 0.002 Ot=-1.25, 0.112 Oz=-1.25, 0.888 O not…
A: Solution: Given: \mu_{0}=15,\bar{x}=14.2, n=25,s=3.2,\alpha=0.05
Q: Using the scatter plot shown above, which one is the more appropriate statistical test, the Pearson…
A: Correlation is used to find the relationship between two variables.Spearman's rank correlation…
Q: Determining whether two samples are independent or paired a... A purchasing manager for a large…
A: Please like my answer..... It supports me a lot..?
Q: Find the value for each t Prompt n = 18 for the 99% confidence interval for the mean. Answer Choose…
A: It is given that the different sample size and confidence interval in each case.
Q: Several years ago, 50% of parents who had children in grades K-12 were satisfied with the quality of…
A: Given claim: 50% of the parents who had children in grades K-12 were satisfied with the quality of…
Q: A marketing consultant was hired to visit a random sample of five sporting goods stores across the…
A: The data is net sales for 1 month before and 1 month after the consultant's visit were recorded.
Q: 1. a. Provide two independent events that you know the probability of. b. Explain how you know these…
A:
Q: Let X and Y be zero-mean independent Gaussian random variables with common variance o². If Z = √X² +…
A:
Q: Cigarette Smoking A researcher found that a cigarette smoker smokes or average 31 cigarettes a day.…
A: Given information Population mean µ = 31 Sample size (n) = 10 Mean x̅ = 28 Standard deviation (s) =…
Q: It takes an average of 13.1 minutes for blood to begin clotting after an injury. An EMT wants to see…
A: One sample t-test: One sample t-test is used to compare the significance difference between sample…
Q: The average financial aid package for students admitted to a particular college five years ago was…
A: We have given that The average financial aid package for students admitted to a particular college…
Q: In a survey of 2035 adults in a certain country conducted during a period of economic uncertainty,…
A:
Q: Assume that you plan to use a significance level of a = 0.05 to test the claim that p1 = p2 . Use…
A: given data n1 = 100x1 = 42n2 = 100x2 = 45α = 0.05claim : p1 = p2
Q: How do I go about these two questions followin this asnwer above: B) Ater removing the point with…
A: b) After removing the cordinate (2, 9) we make the following table for the calculation of regression…
Q: a. What is a residual? b. In what sense is the regression line the straight line that "best" fits…
A: In a linear regression model. we have one dependent variable and one independent variable.
Q: 3) If the true odds ratio calculated above was significantly different from the observed odds ratio…
A: In selection bias, the selected sample is different from the corresponding population which leads…
Q: у" X y y = 1 820 Use exponential regression to find an exponential function that best fits this…
A: The data shows the two variables with x and y variables.
Q: Sussivu ound to one decimal place as needed.) hat are the null and alternative hypotheses? ▼ versus…
A:
Q: c. Develop the estimated regression equation that could be used to predict the price given the…
A: The data shows the price and weight for 18 SA helmets.
Q: researcher would like to predict the dependent variable YY from the two independent variables X1X1…
A: The data shows the dependent variable Y and the two independent variables X1 and X2 for a sample of…
Q: A sociologist found that in a sample of 50 retired men, the average number of jobs they had during…
A: The margin of error from confidence interval for population mean is…
Q: You are interested in finding a 95% confidence interval for the average commute that non-residential…
A: The data shows the number of commute miles for 11 randomly selected non-residential college…
Q: recent study of 35 Grade5 students, the mean number ours per week that they played video games was…
A: We have given that, Mean = 16.6, sample size (n) = 35 and population standard deviation = 2.8
Q: A doctor released the results of clinical trials for a vaccine to prevent a particular disease. In…
A: Introduction: The study is regarding a clinical trial in which one group of children receive a…
Q: If r = -0.58 and n = 40, what is our statistic and critical value?
A: Let ρ denotes the population correlation coefficient. Let us consider the hypothesis: H0:ρ=0 vs.…
Q: Dr. M wanted to estimate the mean cholesterol level for men living in Hartford. He took a sampled of…
A: Given,sample size(n)=20Mean(x¯)=86Standard deviation(s)=12
Q: What happens to measures of effect size such as r2 and Cohen's d as sample size increases? a.…
A: Introduction: It is required to identify the correct option.
Q: The data show the number of viewers for television stars with certain salaries. Find the regression…
A: The data shows the number of viewers for television stars with certain salaries.
Q: Determine whether the following possible responses should be classified as interval, nominal or…
A: The question is about level of measurements Introduction : Nominal : In this case data is only named…
Q: What is the relationship between the F-ratio for a repeated-measures ANOVA and the F-ratio for an…
A: The relationship between the F-ratio for a repeated-measures ANOVA and the F-ratio for an…
Q: what is the total degrees of freedom for this data?
A: Question 16: The data shows the three groups of 30 individuals.

Step by step
Solved in 4 steps
