Ho: p < 0.5; Hạ: p = 0.5 O Ho: p = 0.5; Hạ: p > 0.5 O Họ: p - 0.5; Hạ:p < 0.5 O Hg: p - 0.5; Hạ: p • 0.5 (b) What sampling distribution will you use? O The Student's t, since np < 5 and ng < 5. The standard normal, since np > 5 and ng > S. O The standard normal, since np < 5 and ng < 5. O The Student's t, since np > 5 and ng > 5. What is the value of the sample test statistic? (Round your answer to two decimal places.) -2.43324x (C) Find the P-value of the test statistic. (Round your answer to four decimal places.) 0.0068 Sketch the sampling distribution and show the area corresponding to the P-value. (d) Based on your answers in parts (a) to (c), will you reject or fail to reject the null hypothesis? Are the data statisticlly significant at k At the a - 0.01 level, we reject the null hypothesis and conclude the data are statistically significant. O At the a - 0.01 level, we reject the null hypothesis and conclude the data are not statistically significant. At the a- 0.01 level, we fail to reject the null hypothesis and conclude the data are statistically significant. • At the a- 0.01 level, we fail to reject the null hypothesis and conclude the data are not statistically significant.
Ho: p < 0.5; Hạ: p = 0.5 O Ho: p = 0.5; Hạ: p > 0.5 O Họ: p - 0.5; Hạ:p < 0.5 O Hg: p - 0.5; Hạ: p • 0.5 (b) What sampling distribution will you use? O The Student's t, since np < 5 and ng < 5. The standard normal, since np > 5 and ng > S. O The standard normal, since np < 5 and ng < 5. O The Student's t, since np > 5 and ng > 5. What is the value of the sample test statistic? (Round your answer to two decimal places.) -2.43324x (C) Find the P-value of the test statistic. (Round your answer to four decimal places.) 0.0068 Sketch the sampling distribution and show the area corresponding to the P-value. (d) Based on your answers in parts (a) to (c), will you reject or fail to reject the null hypothesis? Are the data statisticlly significant at k At the a - 0.01 level, we reject the null hypothesis and conclude the data are statistically significant. O At the a - 0.01 level, we reject the null hypothesis and conclude the data are not statistically significant. At the a- 0.01 level, we fail to reject the null hypothesis and conclude the data are statistically significant. • At the a- 0.01 level, we fail to reject the null hypothesis and conclude the data are not statistically significant.

Glencoe Algebra 1, Student Edition, 9780079039897, 0079039898, 2018
18th Edition
ISBN:9780079039897
Author:Carter
Publisher:Carter
Chapter10: Statistics
Section10.6: Summarizing Categorical Data
Problem 10CYU

Related questions

Topic Video
Question
Hi could you correct the wrong questions?
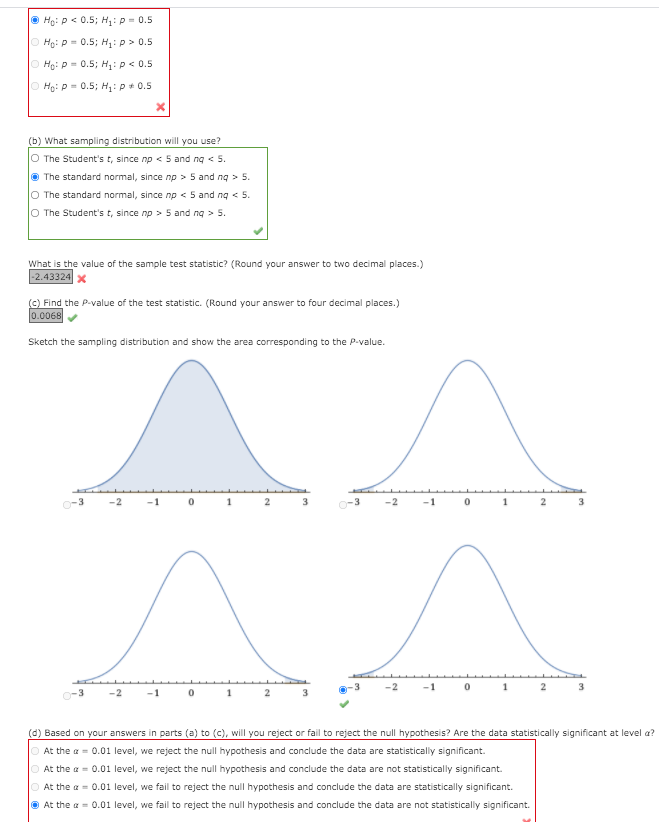
Transcribed Image Text:O Ho: P< 0.5; H: p = 0.5
O Ho: p = 0.5; H,:p> 0.5
O Ho: P = 0.5; H: p < 0.5
O Ho: P = 0.5; H: p+ 0.5
(b) What sampling distribution will you use?
O The Student's t, since np < 5 and ng < 5.
O The standard normal, since np > 5 and ng > 5.
O The standard normal, since np < 5 and ng < 5.
O The Student's t, since np > 5 and ng > 5.
What is the value of the sample test statistic? (Round your answer to two decimal places.)
-2.43324x
(C) Find the P-value of the test statistic. (Round your answer to four decimal places.)
0.0068
Sketch the sampling distribution and show the area corresponding to the P-value.
^^
1
-1
3
-1
1
(d) Based on your answers in parts (a) to (c), will you reject or fail to reject the null hypothesis? Are the data statistically significant at level a?
O At the a = 0.01 level, we reject the null hypothesis and conclude the data are statistically significant.
O At the a = 0.01 level, we reject the null hypothesis and conclude the data are not statistically significant.
O At the a = 0.01 level, we fail to reject the null hypothesis and conclude the data are statistically significant.
O At the a = 0.01 level, we fail to reject the null hypothesis and conclude the data are not statistically significant.

Transcribed Image Text:The following is based on information from The Wolf in the Southwest: The Making of an Endangered Species, by David E. Brown (University of Arizona Press). Before 1918, the proportion of
female wolves in the general population of all southwestern wolves was about 50%. However, after 1918, southwestern cattle ranchers began a widespread effort to destroy wolves. Ina recent
sample of 37 wolves, there were only 11 females. One theory is that male wolves tend to return sooner than females to their old territories, where their predecessors were exterminated. Do these
data indicate that the population proportion of female wolves is now less than 50% in the region? Use a = 0.01.
Expert Solution
This question has been solved!
Explore an expertly crafted, step-by-step solution for a thorough understanding of key concepts.

Step by step
Solved in 2 steps with 2 images

Knowledge Booster


Learn more about
Need a deep-dive on the concept behind this application? Look no further. Learn more about this topic, statistics and related others by exploring similar questions and additional content below.Recommended textbooks for you
Glencoe Algebra 1, Student Edition, 9780079039897…
Algebra
ISBN:
9780079039897
Author:
Carter
Publisher:
McGraw Hill

Holt Mcdougal Larson Pre-algebra: Student Edition…
Algebra
ISBN:
9780547587776
Author:
HOLT MCDOUGAL
Publisher:
HOLT MCDOUGAL
Glencoe Algebra 1, Student Edition, 9780079039897…
Algebra
ISBN:
9780079039897
Author:
Carter
Publisher:
McGraw Hill
Holt Mcdougal Larson Pre-algebra: Student Edition…
Algebra
ISBN:
9780547587776
Author:
HOLT MCDOUGAL
Publisher:
HOLT MCDOUGAL