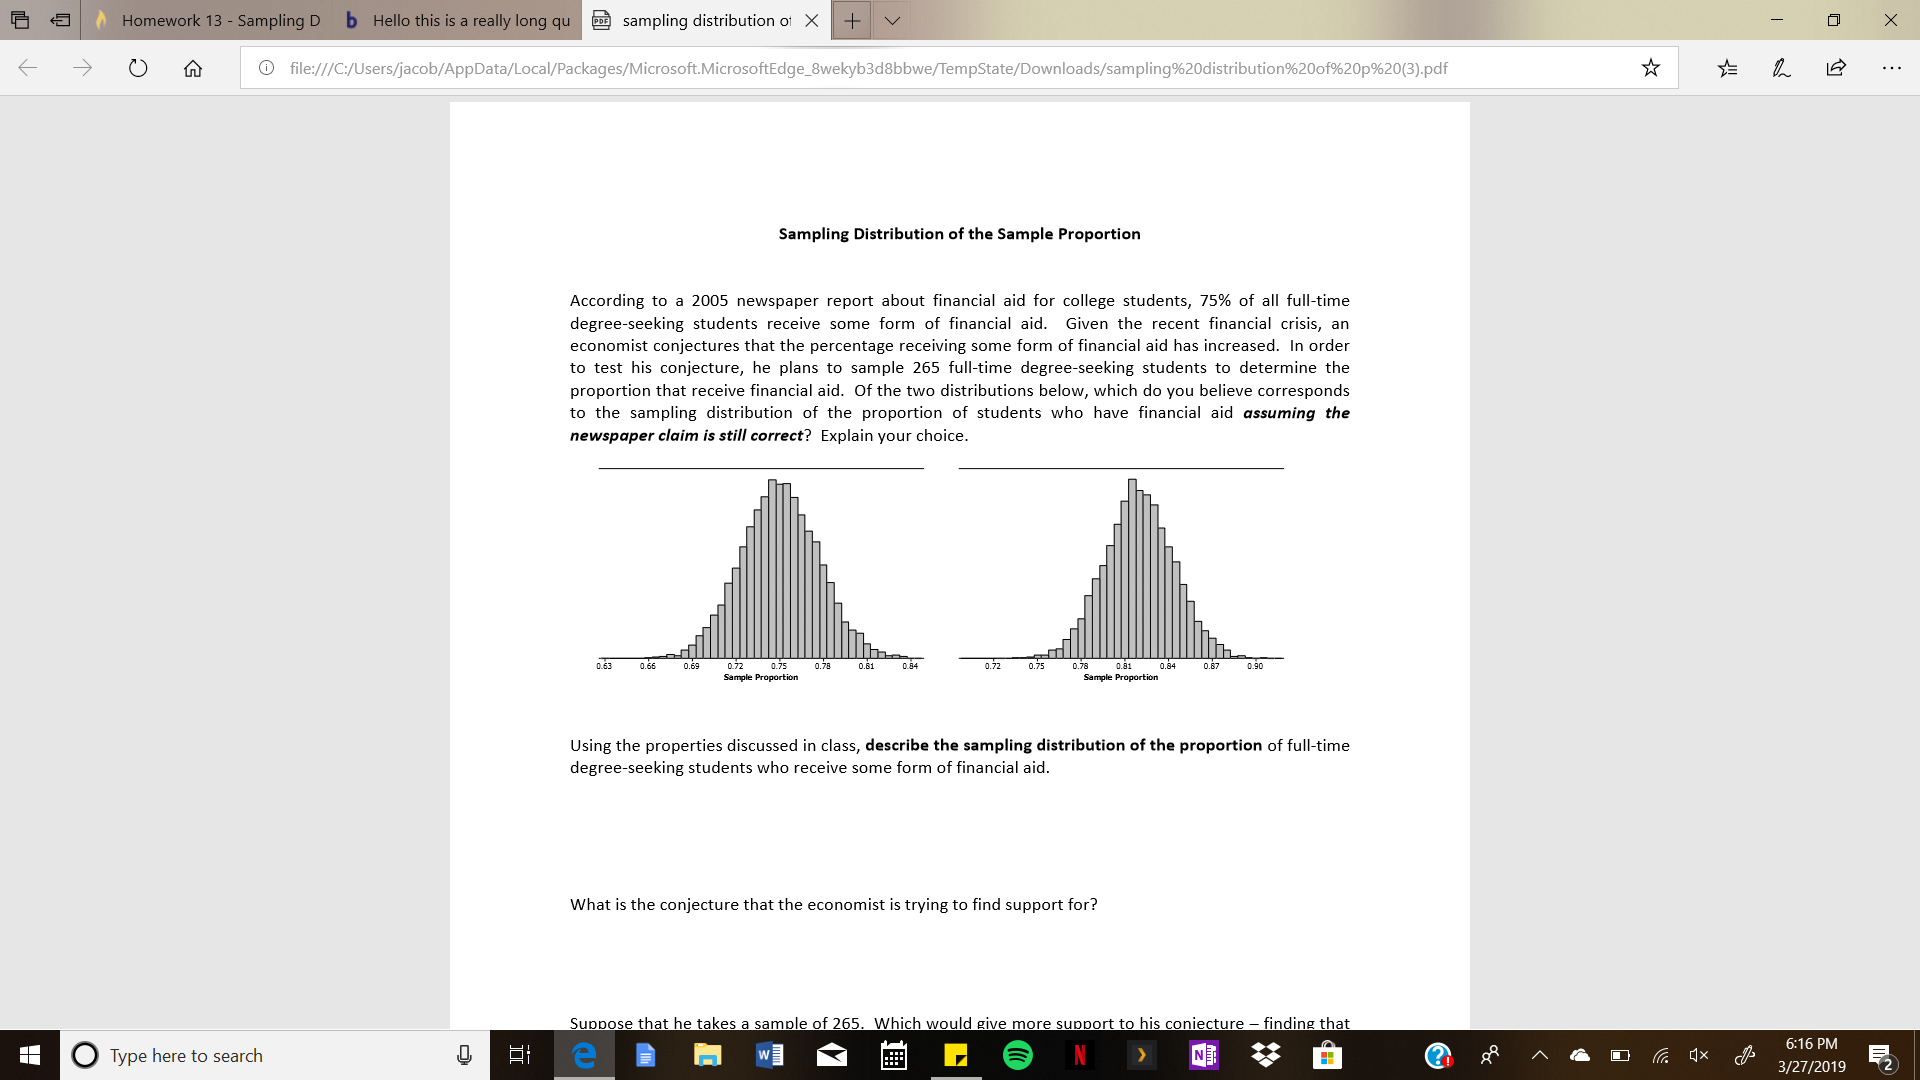
Homework 13 - Sampling D b Hello this is a really long qusampling distribution o x ← → 。 ⓘfile ///C /Users acob/AppData/Local/Packages/Microsoft MicrosoftEdge Swekyb3d8bbwe/TempState/Downloads/sampling%20distribution%20of%20p%203.pdf Sampling Distribution of the Sample Proportion According to a 2005 newspaper report about financial aid for college students, 75% of all full-time degree-seeking students receive some form of financial aid. Given the recent financial crisis, an economist conjectures that the percentage receiving some form of financial aid has increased. In order to test his conjecture, he plans to sample 265 full-time degree-seeking students to determine the proportion that receive financial aid. Of the two distributions below, which do you believe corresponds to the sampling distribution of the proportion of students who have financial aid assuming the newspaper claim is still correct? Explain your choice 0.63 0.66 0.69 0.72 0.75 0.78 0.81 0.84 0.72 0.75 0.78 0.81 0.84 0.87 0.90 Sample Proportion Sample Proportion Using the properties discussed in class, describe the sampling distribution of the proportion of full-time degree-seeking students who receive some form of financial aid What is the conjecture that the economist is trying to find support for? Suppose that he takes a sample of 265. Which would give more support to his coniecture -finding that 6:16 PM Type here to search 3/27/2019 2


What is the conjecture that the economist is trying to find support for?
Suppose that he takes a sample of 265. Which would give more support to his conjecture – finding that 204 students received financial aid or that 215 students received financial aid? Explain your choice.
Assuming the newspaper’s claim is correct, find the probability of observing 204 or more students on financial aid and the probability of finding 215 or more students on financial aid. How do the two probabilities relate to the answer you gave to the previous question?
0.840 .810 .780 .750 .720 .690 .660 .63 Sample Proportion
0.900 .870 .840 .810 .780 .750 .72 Sample Proportion
According to an article on webmd.com, 28.6% of Kentucky residents smoked in 2000. After significant advertising campaigns by the American Cancer Society, a researcher would like to know if the proportion of smokers has decreased. A random sample of 672 Kentucky residents is taken, and each is asked whether or not they smoke.
What is the conjecture that we would like to find evidence for?
Completely describe the sampling distribution for the sample proportion of Kentucky residents that smoke when samples of size 672 are taken.
Suppose that a sample of 672 residents is taken, and 27.9% smoke. Assuming the webmd value of 28.6% is still accurate, what is the probability of observing a smoking percentage of 27.9% or less in this sample?
Based on the probability, what (if anything) can be inferred about the true percentage of KY residents


Trending now
This is a popular solution!

Step by step
Solved in 6 steps with 1 images


