Hormone replacement therapy (HRT) is thought to increase the risk of breast cancer. The accompanying data on x = percent of women using HRT and y = breast cancer incidence (cases per 100,000 women) for a region in Germany for 5 years appeared in the paper "Decline in Breast Cancer Incidence after Decrease in Utilization of Hormone Replacement Therapy." The authors of the paper used a simple linear regression model to describe the relationship between HRT use and breast cancer incidence. HRT Use Breast Cancer Incidence 46.30 40.60 39.50 103.30 105.00 100.00 36.60 30.00 93.80 83.50 (a) What is the equation of the estimated regression line? (Round your answers to three decimal places.) ŷ + X (b) What is the estimated average change in breast cancer incidence associated with a 1 percentage point increase in HRT use? (Round your answer to three decimal places.) cases per 100,000 women (c) What would you predict the breast cancer incidence to be in a year when HRT use was 45%? (Round your answer to three decimal places.) cases per 100,000 women (d) Should you use this regression model to predict breast cancer incidence for a year when HRT use was 23%? Explain. No, this is not advisable as 23 is outside of the range of the x-values in the original data set. Yes, this is advisable as 23 is outside of the range of the x-values in the original data set. No, this is not advisable as 23 is outside of the range of the y-values in the original data set. Yes, this is advisable as 23 is outside of the range of the y-values in the original data set. (e) Calculate the value of r². (Round your answer to three decimal places.) Interpret the value of r². (e) Calculate the value of r². (Round your answer to three decimal places.) (f) Interpret the value of r². This is the percent of variability in breast cancer incidence that can be explained by the approximate linear relationship between breast cancer incidence and percent of women using HRT. This is the rate of variability in breast cancer incidence that can be explained by the approximate linear relationship between breast cancer incidence and percent of women using HRT. This is the rate of variability in HRT use that can be explained by the approximate linear relationship between breast cancer incidence and percent of women using HRT. This is the percent of variability in HRT use that can be explained by the approximate linear relationship between breast cancer incidence and percent of women using HRT. Calculate the value of Se. (Round your answer to three decimal places.) Interpret the value of Se This is a typical deviation of breast cancer incidence value in this data set from the value predicted by the estimated regression line. This is a typical deviation of HRT use in this data set from the value predicted by the estimated regression line. This is average HRT use in this data set from the value predicted by the estimated regression line. This is the average breast cancer incidence value in this data set from the value predicted by the estimated regression line.
Hormone replacement therapy (HRT) is thought to increase the risk of breast cancer. The accompanying data on x = percent of women using HRT and y = breast cancer incidence (cases per 100,000 women) for a region in Germany for 5 years appeared in the paper "Decline in Breast Cancer Incidence after Decrease in Utilization of Hormone Replacement Therapy." The authors of the paper used a simple linear regression model to describe the relationship between HRT use and breast cancer incidence. HRT Use Breast Cancer Incidence 46.30 40.60 39.50 103.30 105.00 100.00 36.60 30.00 93.80 83.50 (a) What is the equation of the estimated regression line? (Round your answers to three decimal places.) ŷ + X (b) What is the estimated average change in breast cancer incidence associated with a 1 percentage point increase in HRT use? (Round your answer to three decimal places.) cases per 100,000 women (c) What would you predict the breast cancer incidence to be in a year when HRT use was 45%? (Round your answer to three decimal places.) cases per 100,000 women (d) Should you use this regression model to predict breast cancer incidence for a year when HRT use was 23%? Explain. No, this is not advisable as 23 is outside of the range of the x-values in the original data set. Yes, this is advisable as 23 is outside of the range of the x-values in the original data set. No, this is not advisable as 23 is outside of the range of the y-values in the original data set. Yes, this is advisable as 23 is outside of the range of the y-values in the original data set. (e) Calculate the value of r². (Round your answer to three decimal places.) Interpret the value of r². (e) Calculate the value of r². (Round your answer to three decimal places.) (f) Interpret the value of r². This is the percent of variability in breast cancer incidence that can be explained by the approximate linear relationship between breast cancer incidence and percent of women using HRT. This is the rate of variability in breast cancer incidence that can be explained by the approximate linear relationship between breast cancer incidence and percent of women using HRT. This is the rate of variability in HRT use that can be explained by the approximate linear relationship between breast cancer incidence and percent of women using HRT. This is the percent of variability in HRT use that can be explained by the approximate linear relationship between breast cancer incidence and percent of women using HRT. Calculate the value of Se. (Round your answer to three decimal places.) Interpret the value of Se This is a typical deviation of breast cancer incidence value in this data set from the value predicted by the estimated regression line. This is a typical deviation of HRT use in this data set from the value predicted by the estimated regression line. This is average HRT use in this data set from the value predicted by the estimated regression line. This is the average breast cancer incidence value in this data set from the value predicted by the estimated regression line.

Trigonometry (MindTap Course List)
8th Edition
ISBN:9781305652224
Author:Charles P. McKeague, Mark D. Turner
Publisher:Charles P. McKeague, Mark D. Turner
Chapter4: Graphing And Inverse Functions
Section: Chapter Questions
Problem 6GP: If your graphing calculator is capable of computing a least-squares sinusoidal regression model, use...
Question
13.1.4
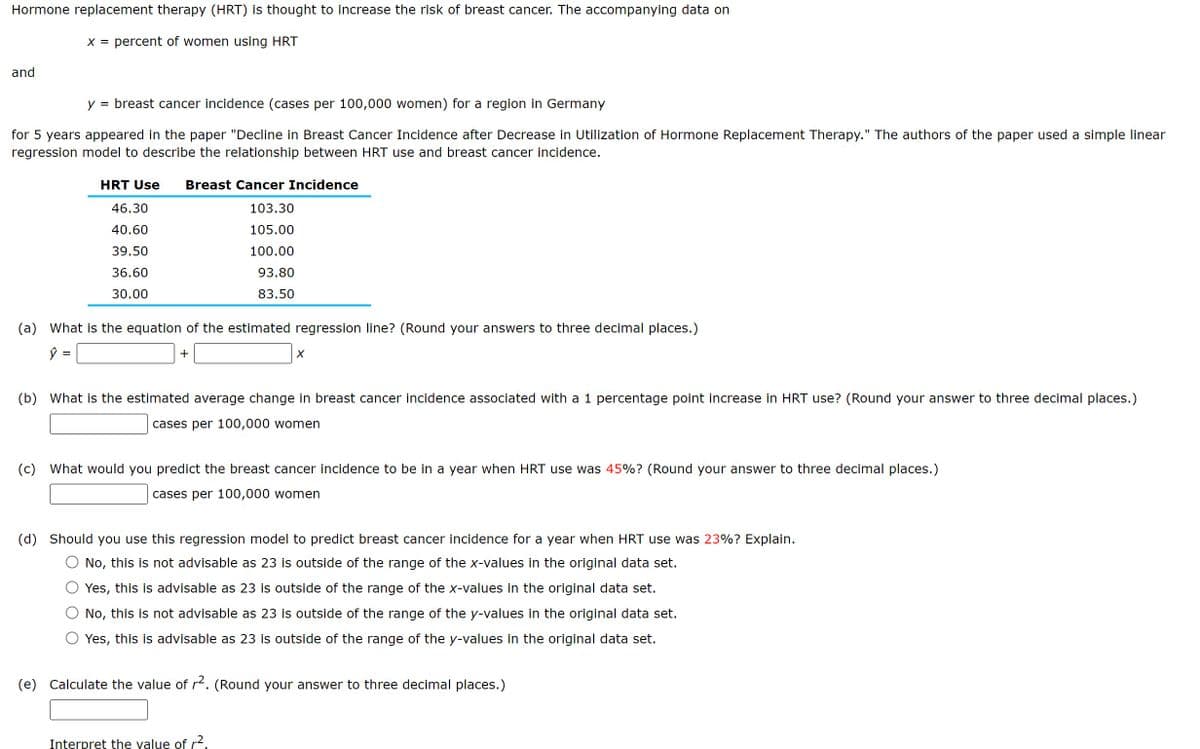
Transcribed Image Text:Hormone replacement therapy (HRT) is thought to increase the risk of breast cancer. The accompanying data on
x = percent of women using HRT
and
y =
breast cancer incidence (cases per 100,000 women) for a region in Germany
for 5 years appeared in the paper "Decline in Breast Cancer Incidence after Decrease in Utilization of Hormone Replacement Therapy." The authors of the paper used a simple linear
regression model to describe the relationship between HRT use and breast cancer incidence.
HRT Use Breast Cancer Incidence
46.30
40.60
39.50
103.30
105.00
100.00
36.60
30.00
93.80
83.50
(a) What is the equation of the estimated regression line? (Round your answers to three decimal places.)
ŷ
+
X
(b) What is the estimated average change in breast cancer incidence associated with a 1 percentage point increase in HRT use? (Round your answer to three decimal places.)
cases per 100,000 women
(c) What would you predict the breast cancer incidence to be in a year when HRT use was 45%? (Round your answer to three decimal places.)
cases per 100,000 women
(d) Should you use this regression model to predict breast cancer incidence for a year when HRT use was 23%? Explain.
No, this is not advisable as 23 is outside of the range of the x-values in the original data set.
Yes, this is advisable as 23 is outside of the range of the x-values in the original data set.
No, this is not advisable as 23 is outside of the range of the y-values in the original data set.
Yes, this is advisable as 23 is outside of the range of the y-values in the original data set.
(e) Calculate the value of r². (Round your answer to three decimal places.)
Interpret the value of r².
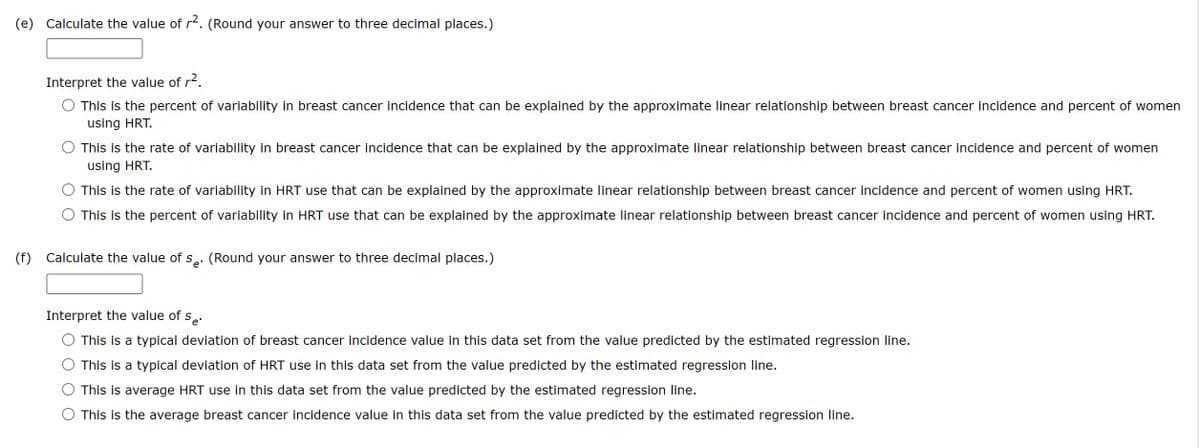
Transcribed Image Text:(e) Calculate the value of r². (Round your answer to three decimal places.)
(f)
Interpret the value of r².
This is the percent of variability in breast cancer incidence that can be explained by the approximate linear relationship between breast cancer incidence and percent of women
using HRT.
This is the rate of variability in breast cancer incidence that can be explained by the approximate linear relationship between breast cancer incidence and percent of women
using HRT.
This is the rate of variability in HRT use that can be explained by the approximate linear relationship between breast cancer incidence and percent of women using HRT.
This is the percent of variability in HRT use that can be explained by the approximate linear relationship between breast cancer incidence and percent of women using HRT.
Calculate the value of Se. (Round your answer to three decimal places.)
Interpret the value of Se
This is a typical deviation of breast cancer incidence value in this data set from the value predicted by the estimated regression line.
This is a typical deviation of HRT use in this data set from the value predicted by the estimated regression line.
This is average HRT use in this data set from the value predicted by the estimated regression line.
This is the average breast cancer incidence value in this data set from the value predicted by the estimated regression line.
Expert Solution
This question has been solved!
Explore an expertly crafted, step-by-step solution for a thorough understanding of key concepts.

Step by step
Solved in 2 steps with 2 images

Recommended textbooks for you
Trigonometry (MindTap Course List)
Trigonometry
ISBN:
9781305652224
Author:
Charles P. McKeague, Mark D. Turner
Publisher:
Cengage Learning

Trigonometry (MindTap Course List)
Trigonometry
ISBN:
9781305652224
Author:
Charles P. McKeague, Mark D. Turner
Publisher:
Cengage Learning