How did population growth curve with LOW migration compare with the normal population growth curve? How did population growth curve with High migration compare with normal population growth curve?
How did population growth curve with LOW migration compare with the normal population growth curve? How did population growth curve with High migration compare with normal population growth curve?

Biology: The Unity and Diversity of Life (MindTap Course List)
15th Edition
ISBN:9781337408332
Author:Cecie Starr, Ralph Taggart, Christine Evers, Lisa Starr
Publisher:Cecie Starr, Ralph Taggart, Christine Evers, Lisa Starr
Chapter44: Population Ecology
Section: Chapter Questions
Problem 10SQ

Related questions

Question
100%
How did population growth curve with LOW migration compare with the normal population growth curve? How did population growth curve with High migration compare with normal population growth curve?
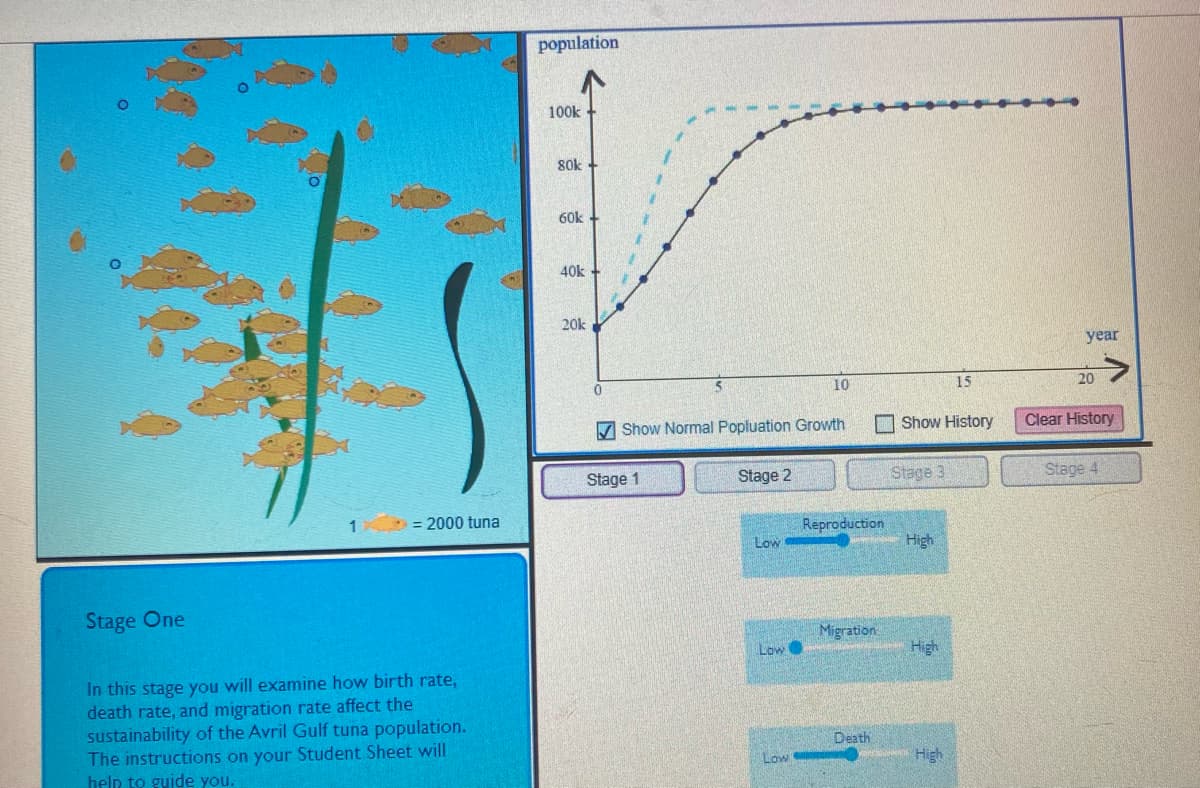
Transcribed Image Text:population
100k
S0k
60k
40k
20k
year
10
15
20
V Show Normal Popluation Growth
Show History
Clear History
Stage 1
Stage 2
Stage 3
Stage 4
= 2000 tuna
Reproduction
High
Low
Stage One
Migration
Low
High
In this stage you will examine how birth rate,
death rate, and migration rate affect the
sustainability of the Avril Gulf tuna population.
The instructions on your Student Sheet will
help to guide you.
Death
Low
High
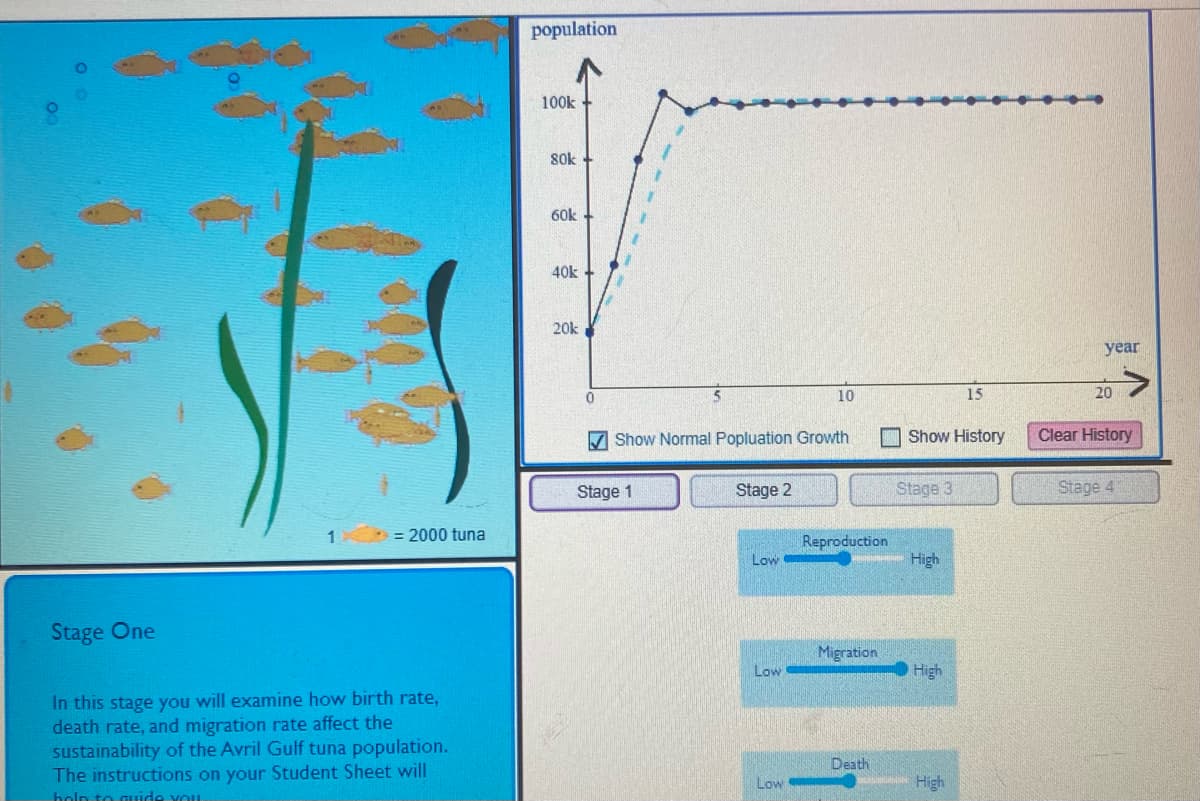
Transcribed Image Text:population
100k
80k
60k
40k
20k
year
0.
10
15
20
V Show Normal Popluation Growth
Show History
Clear History
Stage 1
Stage 2
Stage 3
Stage 4
= 2000 tuna
Reproduction
Low
High
Stage One
Migration
Low
High
In this stage you will examine how birth rate,
death rate, and migration rate affect the
sustainability of the Avril Gulf tuna population.
The instructions on your Student Sheet will
Death
Low
High
help to quide vou.
Expert Solution
This question has been solved!
Explore an expertly crafted, step-by-step solution for a thorough understanding of key concepts.

This is a popular solution!

Trending now
This is a popular solution!

Step by step
Solved in 2 steps

Knowledge Booster


Learn more about
Need a deep-dive on the concept behind this application? Look no further. Learn more about this topic, biology and related others by exploring similar questions and additional content below.Recommended textbooks for you
Biology: The Unity and Diversity of Life (MindTap…
Biology
ISBN:
9781337408332
Author:
Cecie Starr, Ralph Taggart, Christine Evers, Lisa Starr
Publisher:
Cengage Learning

Biology: The Unity and Diversity of Life (MindTap…
Biology
ISBN:
9781305073951
Author:
Cecie Starr, Ralph Taggart, Christine Evers, Lisa Starr
Publisher:
Cengage Learning

Concepts of Biology
Biology
ISBN:
9781938168116
Author:
Samantha Fowler, Rebecca Roush, James Wise
Publisher:
OpenStax College
Biology: The Unity and Diversity of Life (MindTap…
Biology
ISBN:
9781337408332
Author:
Cecie Starr, Ralph Taggart, Christine Evers, Lisa Starr
Publisher:
Cengage Learning
Biology: The Unity and Diversity of Life (MindTap…
Biology
ISBN:
9781305073951
Author:
Cecie Starr, Ralph Taggart, Christine Evers, Lisa Starr
Publisher:
Cengage Learning
Concepts of Biology
Biology
ISBN:
9781938168116
Author:
Samantha Fowler, Rebecca Roush, James Wise
Publisher:
OpenStax College

Case Studies In Health Information Management
Biology
ISBN:
9781337676908
Author:
SCHNERING
Publisher:
Cengage

Biology 2e
Biology
ISBN:
9781947172517
Author:
Matthew Douglas, Jung Choi, Mary Ann Clark
Publisher:
OpenStax

Biology Today and Tomorrow without Physiology (Mi…
Biology
ISBN:
9781305117396
Author:
Cecie Starr, Christine Evers, Lisa Starr
Publisher:
Cengage Learning