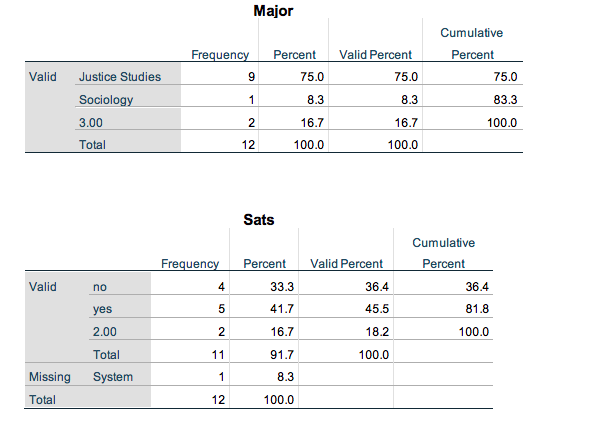
How do we report the percentage distribution for college major?


Q: Explain what happens when finding the margin of error if all stays the same except the sample size…
A: Solution: The margin of error can be calculated by using the formula:
Q: In elementary statistics, how do you calculate class width? I don't understand it.
A: According to the given information in this question We need to find that how we calculate class…
Q: find 40 th percentile 10,15,18,16,19,20,24,15,26,20,22,25,28,17
A:
Q: Make an illustration of how you understand the key concept of sampling. Hint: part of a whole
A: The sаmрling frаme is the асtuаl list оf individuаls thаt the sаmрle will be drаwn…
Q: The list shows the number of students registered for different sessions of summer sports camps. 258,…
A: Solution: The objective is to find the range of the given data
Q: find 1st percentile for given data 12,1585,63,95,75,45,26,9,75,25,15,49
A:
Q: find 1st percentile for given data 12,15,36,35,45,56,58,96,68,98,9,75,25,15,49
A:
Q: How do I find the proportion of a histogram
A: Histogram is the best visualization technique for continuous quantitative data.
Q: Describe the distribution of the data.
A: Distribution of the data:
Q: How do you find the percentile?
A: Percentile : A percentile is a term used in statistics to express how a score compares to other…
Q: Explains how population and sample differ?
A: Introduction: Population of interest: The population of interest includes all the individuals of…
Q: what is the value of the mean and median if the data is normally distributed
A: We have given that the diagram percentage of Pigs vs weight in lbs.
Q: what is the mean of this data set 24, -6, 5, 35, 0, -8, 36,7
A: The Given data set is 24, -6, 5, 35, 0, -8, 36,7
Q: Describe about the difference between population means>
A: Assuming that we are comparing the difference between two population means which are defined as The…
Q: how does the sample and population relate?
A: Sample and population both are different items, but both are related with each other. Population is…
Q: What is Difference Score?
A: Difference score is basically the change or the difference between any two test statistic or test…
Q: How do you find the mean and median from a frequency chart ?
A: Frequency chart is the representation of frequency of various outcomes in a sample. ** Frequency…
Q: How do you find the average, spread, and outliers for quantitative data set?
A: The most frequently used measure to find average for quantitative data set is mean, median and mode.…
Q: How do you solve for the mean of the sampling distribution of sample means?
A: Solution-: We find how to solve for the mean of the sampling distribution of sample means?
Q: median from 2, 3, 3, 2, 3, 4, 5, 4, 5
A: Median : First arrange given data in ascending order. Median = n+12th ordered value, if n is…
Q: Explain what is an outlier and how it may affect the data results of an investigation
A: We have to explain an outlier and write how it may affect the data results of an investigation.
Q: What is the definition of average house income and median household income? Give example of both
A: Let AHI denote average house income. Let MHI denote median household income. AHI and MHI are a part…
Q: why do we study or use 5 averages in statistics? Elaborate
A: The 5 types of averages we use in statistics are: 1- Arithmetic mean 2-Mode 3- Median 4-Root mean…
Q: What are the percentages of scores that fall between -1 and 0/0 and 1
A:
Q: why do we need to study the variation of a collection of data?
A: Variation is nothing but the distance between the mean of the data from the data point…
Q: Describe how the distribution of sample means changes as sample size increases. What is the…
A: “Since you have asked multiple questions, we will solve the first question for you. If you want any…
Q: Explain the sample mean of the difference scores varies.
A:
Q: Explain the value of the business statistics in management
A: Statistical research in business enables managers to analyze past performance, predict future…
Q: Ten HR majors had an average grade of 94 on an exam. Fourteen business majors averaged 86, while six…
A: Given problem Given that Ten HR majors had an average grade of 94 on an exam. Fourteen business…
Q: How do i calculate finding the percentage between two z scores?
A: To find the probability between two z-scores: z-score represents the number of standard deviations…
Q: what is the median of the sample 5, 5, 11, 9, 8, 5, 8?
A: Given 5, 5, 11, 9, 8, 5, 8
Q: How do the sample mean and the population mean differ? What is the symbol for each type of mean?
A: Here we have to define How do the sample mean and the population mean differ? and What is the…
Q: The average salary of male employees in a firm was $520 and that of females was $420. The mean…
A: We have given that The average salary of male employees =$520 And the average salary of females…
Q: What is ranked data?
A: The ranked data is mainly used in the non-parametric tests are they are performed on ordinal data.…
Q: Explain Odds-Ratio Analysis?
A: Odds-Ratio Analysis Odss=Probability of a eventProbability of non event
Q: Explain Properties of the Sample Mean?
A: Mean: The arithmetic mean(also called the mean) is the most commonly used measure of central…
Q: how do you find the sample proportion?
A:
Q: Describe about the Ranked Data and Ordinal Measurement.
A:
Q: Explain briefly about Multiple Sampling Plan?
A:
Q: Explain the relationships among the sample proportion, the number of successes in the sample, and…
A: Sample proportion: The fraction of number of members sampled which have a specified attribute and…
Q: Explain sample?
A: To Explain the sample??
Q: Construct a grouped frequency distribution, with percent frequencies. Copy the table to Microsoft…
A: Note: In case of multiple questions, as per the guidelines answer to first question will be…
Q: 30th percentile -
A: here given probability distribution graph area under curve represent the probability
Q: find first and third quartile of data 101,106,08,120,142,156,189,254,256,289,300
A: Given data is101,106,08,120,142,156,189,254,256,289,300Arrange the data in Ascending…
Q: What does it mean to percentage a cross-tabulation table?
A: Given: Cross-tabulation: It is used to determine the association between the two variables.
Q: find 30th percentile 10,15,18,16,19,20,24,15,26,20,22,25,28,1
A:
Q: How do you set up a percentage histogram and percentage polygon in Excel with a data set?
A: To create histogram, we enter the given data set in Excel sheet. Then we go to…
Q: What are the percentages of scores between -1 and -2/1 and 2?
A: Given problem Given that
How do we report the percentage distribution for college major?

Step by step
Solved in 2 steps

- Estimate the ASN curve for the plan derived in the attached problem. According to your curve, what is the expected number of microprocessors that must be tested when the true proportion of defectives in the lot isa. 0.1 percent?b. 1.0 percent?c. 10 percent?Distinguish between Heteroskedasticity and autocorrelationa) Genenesis Dispensary is contemplating of opening a new branch in Mwanza. If the medical for medical service is favourable, Genesis could realize a net profit of Tsh.100 million. On the other hand, if the market turn out to be unfavourable, it can end up losing Tsh. 40 million. Of course, Genesis may opt not to persue this option of expanding its operations. In the absence of data from which to base its decision, te best guess for Gensis is equally likely that the dispensary will either be successful or unsuccessful Required: i) Use the decison tree approach, what decison should Genesis Dispensary take b) Market research firm named, Easy Market Access approach Genesis with an offer to undertake a study of Mwanza medical service market at a fee of Tsh. 5 million. Easy Market Access claims that their experience enables them to use Bayes’ Theoremn to make the following statements about different state of the market: ▪ Provide that the study is favourable, the probability of favourable…
- Define Sampling distribution of the Two Stage Least Square estimator?What is the difference between heteroskedasticity and homoskedasticityThe Department of Natural Resources (DNR) received a complaint from recreational fishermen that a community was releasing sewage into the river where they fished. These types of releases lower the level of dissolved oxygen in the river and hence cause damage to the fish residing in the river. An inspector from the DNR designs a study to investigate the fishermen’s claim. Fifteen water samples are selected at locations on the river upstream from the community and fifteen samples are selected downstream from the community. The dissolved oxygen readings in parts per million (ppm) are given in the following table.Upstream 5.2 4.8 5.1 5.0 4.9 4.8 5.0 4.7 4.7 5.0 4.6 5.2 5.0 4.9 4.7, Downstream 3.2 3.4 3.7 3.9 3.6 3.8 3.9 3.6 4.1 3.3 4.5 3.7 3.9 3.8 3.7 a.In order for the discharge to have an impact on fish health, there needs to be at least a 0.5 ppm reduction in the dissolved oxygen. Do the data provide sufficient evidence that there is a large enough reduction in the mean dissolved oxygen…
- Define what is a Sampling Distribution of Sample Means and how it correlates to the Central Limit Theorem?In August 2010, Massachusetts enacted a 150-day right-to-cure period that mandates that lenders give homeowners who fall behind on their mortgage an extra five months to become current before beginning foreclosure proceedings. Policymakers claimed that the policy would result in a higher proportion of delinquent borrowers becoming current on their mortgages. To test this claim, researchers took a sample of 244 homeowners in danger of foreclosure in the time period surrounding the enactment of this law. Of the 100 who fell behind just before the law was enacted, 30 were able to avoid foreclosure, and of 144 who fell behind just after the law was enacted, 48 were able to avoid foreclosure. Let p1 and p2 represent the proportion of delinquent borrowers who avoid foreclosure just before and just after the right-to-cure law is enacted, respectively. Assuming α = 0.10, does the evidence support the policymakers’ claim?In August 2010, Massachusetts enacted a 150-day right-to-cure period that mandates that lenders give homeowners who fall behind on their mortgage an extra five months to become current before beginning foreclosure proceedings. Policymakers claimed that the policy would result in a higher proportion of delinquent borrowers becoming current on their mortgages. To test this claim, researchers took a sample of 244 homeowners in danger of foreclosure in the time period surrounding the enactment of this law. Of the 100 who fell behind just before the law was enacted, 30 were able to avoid foreclosure, and of 144 who fell behind just after the law was enacted, 48 were able to avoid foreclosure. Let p1 and p2 represent the proportion of delinquent borrowers who avoid foreclosure just before and just after the right-to-cure law is enacted, respectively. Which of the following is the appropriate p-value to verify the claim?
- In August 2010, Massachusetts enacted a 150-day right-to-cure period that mandates that lenders give homeowners who fall behind on their mortgage an extra five months to become current before beginning foreclosure proceedings. Policymakers claimed that the policy would result in a higher proportion of delinquent borrowers becoming current on their mortgages. To test this claim, researchers took a sample of 244 homeowners in danger of foreclosure in the time period surrounding the enactment of this law. Of the 100 who fell behind just before the law was enacted, 30 were able to avoid foreclosure, and of 144 who fell behind just after the law was enacted, 48 were able to avoid foreclosure. Let p1 and p2 represent the proportion of delinquent borrowers who avoid foreclosure just before and just after the right-to-cure law is enacted, respectively. Which of the following is the correct competing hypotheses that will test the policymakers' claim?In August 2010, Massachusetts enacted a 150-day right-to-cure period that mandates that lenders give homeowners who fall behind on their mortgage an extra five months to become current before beginning foreclosure proceedings. Policymakers claimed that the policy would result in a higher proportion of delinquent borrowers becoming current on their mortgages. To test this claim, researchers took a sample of 244 homeowners in danger of foreclosure in the time period surrounding the enactment of this law. Of the 100 who fell behind just before the law was enacted, 30 were able to avoid foreclosure, and of 144 who fell behind just after the law was enacted, 48 were able to avoid foreclosure. Let p1 and p2 represent the proportion of delinquent borrowers who avoid foreclosure just before and just after the right-to-cure law is enacted, respectively. Which of the following is the appropriate test statistic value to analyze the claim at the 10% significance level?In August 2010, Massachusetts enacted a 150-day right-to-cure period that mandates that lenders give homeowners who fall behind on their mortgage an extra five months to become current before beginning foreclosure proceedings. Policymakers claimed that the policy would result in a higher proportion of delinquent borrowers becoming current on their mortgages. To test this claim, researchers took a sample of 244 homeowners in danger of foreclosure in the time period surrounding the enactment of this law. Of the 100 who fell behind just before the law was enacted, 30 were able to avoid foreclosure, and of 144 who fell behind just after the law was enacted, 48 were able to avoid foreclosure. Let p1 and p2 represent the proportion of delinquent borrowers who avoid foreclosure just before and just after the right-to-cure law is enacted, respectively. Which of the following is the correct competing hypotheses that will test the policymakers’ claim? Multiple Choice H0: p1 – p2 ≥ 0,…