How many bagels should the store have at 3 p.m. to maximize the store's expected profit (from sales between 3 p.m. until closing)? (Hint: Assume day-old a. bagels are sold for $0.99/6 = $0.165 each, that is, don't worry about the fact that day-old bagels are sold in bags of six.) Use Table 13.4 and round-up rule. (Round your answer to a whole number.) Suppose the store manager has 97 bagels at 3 p.m. How many bagels should b. the store manager expect to have at the end of the day? Use Table 13.4 and round-up rule. Suppose the manager would like to have a 0.99 in-stock probability on demand c. that occurs after 3 pm. How many bagels should the store have at 3 p.m. to ensure that level of service? Use Table 13.4 and round-up rule.
How many bagels should the store have at 3 p.m. to maximize the store's expected profit (from sales between 3 p.m. until closing)? (Hint: Assume day-old a. bagels are sold for $0.99/6 = $0.165 each, that is, don't worry about the fact that day-old bagels are sold in bags of six.) Use Table 13.4 and round-up rule. (Round your answer to a whole number.) Suppose the store manager has 97 bagels at 3 p.m. How many bagels should b. the store manager expect to have at the end of the day? Use Table 13.4 and round-up rule. Suppose the manager would like to have a 0.99 in-stock probability on demand c. that occurs after 3 pm. How many bagels should the store have at 3 p.m. to ensure that level of service? Use Table 13.4 and round-up rule.

Practical Management Science
6th Edition
ISBN:9781337406659
Author:WINSTON, Wayne L.
Publisher:WINSTON, Wayne L.
Chapter2: Introduction To Spreadsheet Modeling
Section: Chapter Questions
Problem 20P: Julie James is opening a lemonade stand. She believes the fixed cost per week of running the stand...

Related questions
Question
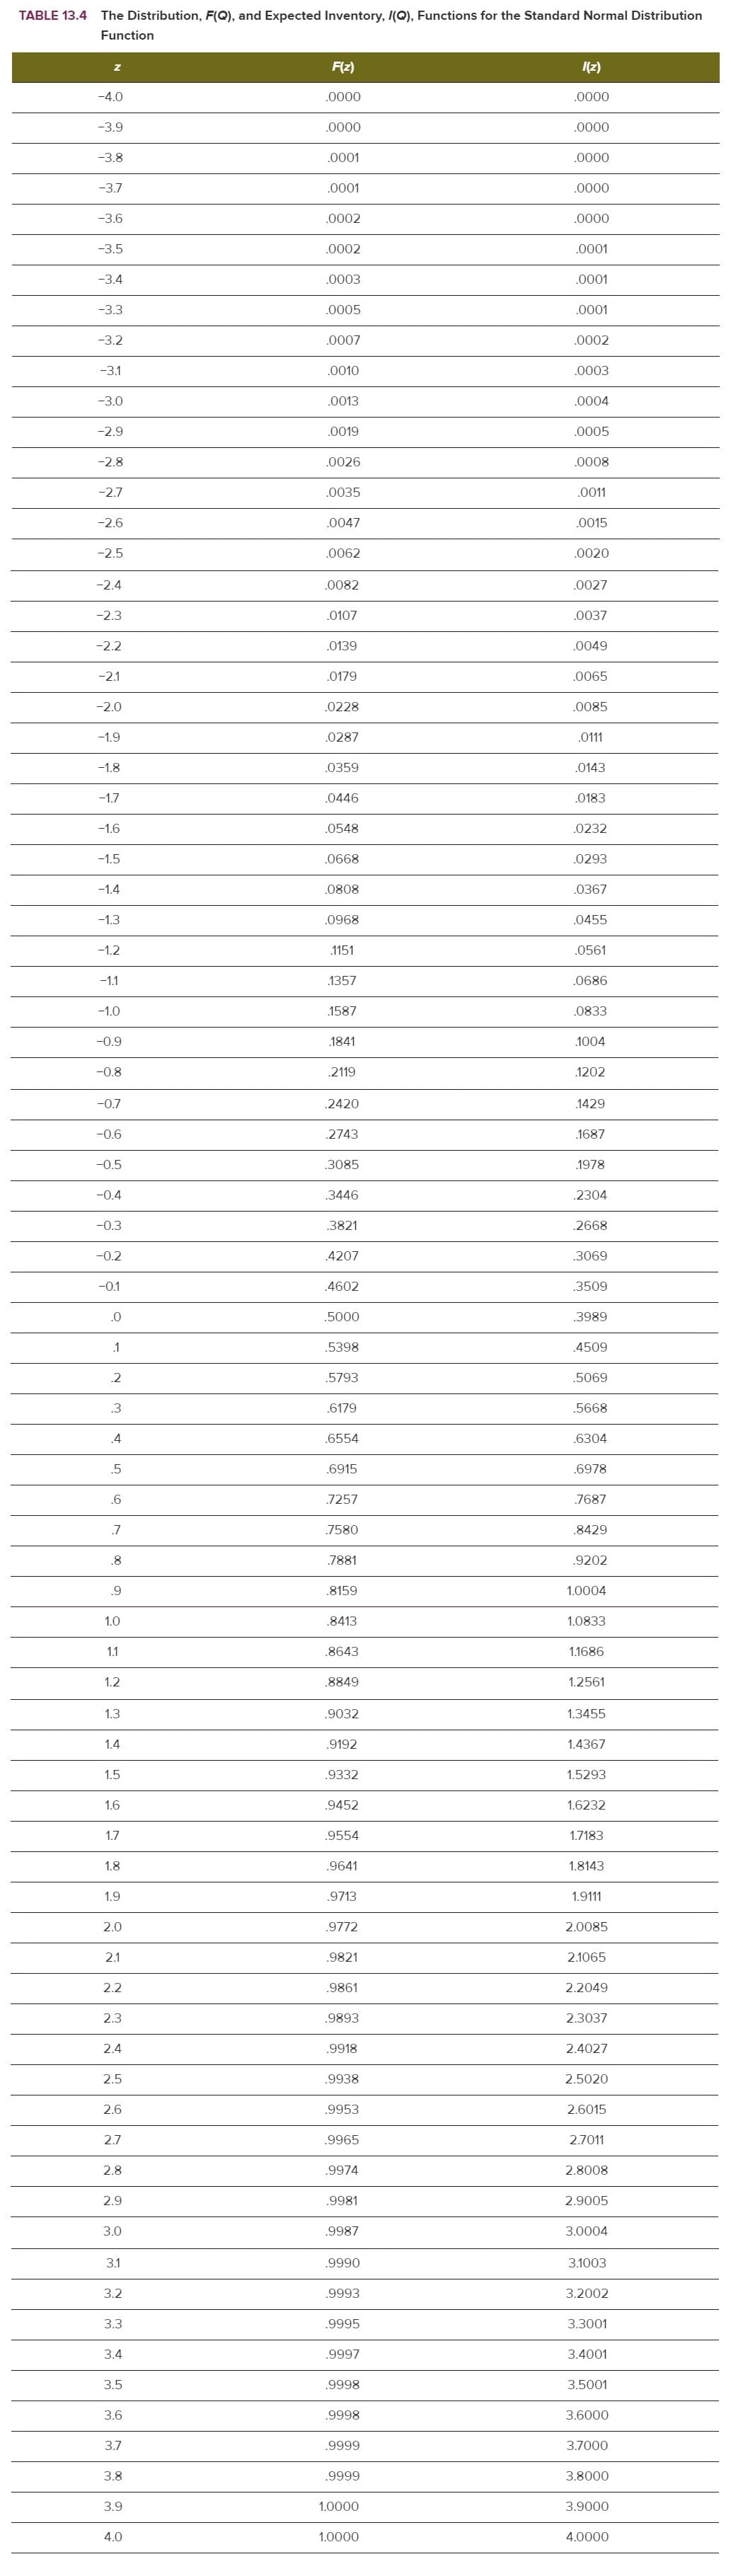
Transcribed Image Text:TABLE 13.4
The Distribution, F(Q), and Expected Inventory, I(Q), Functions for the Standard Normal Distribution
Function
F(z)
(z)
-4.0
.0000
.0000
-3.9
.0000
.0000
-3.8
.0001
.0000
-3.7
.0001
.0000
-3.6
.0002
.0000
-3.5
.0002
.0001
-3.4
.0003
.0001
-3.3
.0005
.0001
-3.2
.0007
.0002
-3.1
.0010
.0003
-3.0
.0013
.0004
-2.9
.0019
.0005
-2.8
.0026
.0008
-2.7
.0035
.0011
-2.6
.0047
.0015
-2.5
.0062
.0020
-2.4
.0082
.0027
-2.3
.0107
.0037
-2.2
.0139
.0049
-2.1
.0179
.0065
-2.0
.0228
.0085
-1.9
.0287
.0111
-1.8
.0359
.0143
-1.7
.0446
.0183
-1.6
.0548
.0232
-1.5
.0668
.0293
-1.4
.0808
.0367
-1.3
.0968
.0455
-1.2
.1151
.0561
-1.1
.1357
.0686
-1.0
.1587
.0833
-0.9
.1841
.1004
-0.8
.2119
1202
-0.7
.2420
.1429
-0.6
.2743
.1687
-0.5
.3085
.1978
-0.4
.3446
.2304
-0.3
.3821
.2668
-0.2
.4207
.3069
-0.1
.4602
3509
.0
.5000
.3989
.1
.5398
4509
.2
.5793
.5069
.3
.6179
.5668
.4
.6554
.6304
.5
.6915
.6978
.6
.7257
.7687
.7
7580
.8429
.8
.7881
.9202
.9
.8159
1.0004
1.0
.8413
1.0833
1.1
.8643
1.1686
1.2
.8849
1.2561
1.3
.9032
1.3455
1.4
.9192
1.4367
1.5
.9332
1.5293
1.6
.9452
1.6232
1.7
.9554
1.7183
1.8
.9641
1.8143
1.9
.9713
1.9111
2.0
.9772
2.0085
2.1
.9821
2.1065
2.2
.9861
2.2049
2.3
.9893
2.3037
2.4
.9918
2.4027
2.5
.9938
2.5020
2.6
.9953
2.6015
2.7
.9965
2.7011
2.8
.9974
2.8008
2.9
.9981
2.9005
3.0
.9987
3.0004
3.1
.9990
3.1003
3.2
.9993
3.2002
3.3
.9995
3.3001
3.4
.9997
3.4001
3.5
.9998
3.5001
3.6
.9998
3.6000
3.7
.9999
3.7000
3.8
.9999
3.8000
3.9
1.0000
3.9000
4.0
1.0000
4.0000
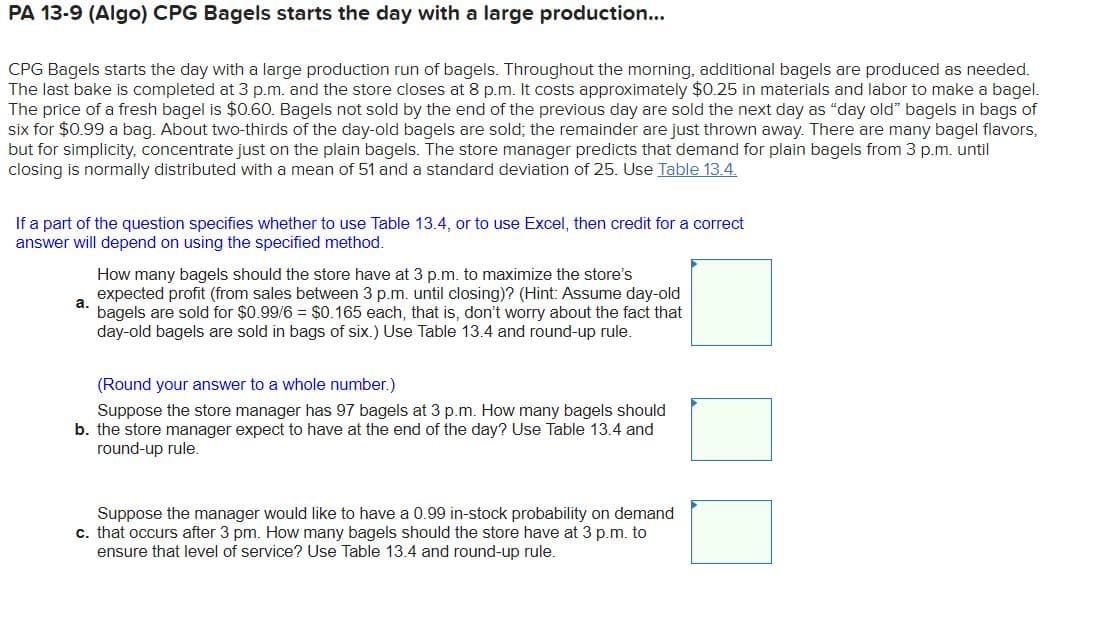
Transcribed Image Text:PA 13-9 (Algo) CPG Bagels starts the day with a large production...
CPG Bagels starts the day with a large production run of bagels. Throughout the morning, additional bagels are produced as needed.
The last bake is completed at 3 p.m. and the store closes at 8 p.m. It costs approximately $0.25 in materials and labor to make a bagel.
The price of a fresh bagel is $0.60. Bagels not sold by the end of the previous day are sold the next day as "day old" bagels in bags of
six for $0.99 a bag. About two-thirds of the day-old bagels are sold; the remainder are just thrown away. There are many bagel flavors,
but for simplicity, concentrate just on the plain bagels. The store manager predicts that demand for plain bagels from 3 p.m. until
closing is normally distributed with a mean of 51 and a standard deviation of 25. Use Table 13.4.
If a part of the question specifies whether to use Table 13.4, or to use Excel, then credit for a correct
answer will depend on using the specified method.
How many bagels should the store have at 3 p.m. to maximize the store's
expected profit (from sales between 3 p.m. until closing)? (Hint: Assume day-old
а.
bagels are sold for $0.99/6 = $0.165 each, that is, don't worry about the fact that
day-old bagels are sold in bags of six.) Use Table 13.4 and round-up rule.
(Round your answer to a whole number.)
Suppose the store manager has 97 bagels at 3 p.m. How many bagels should
b. the store manager expect to have at the end of the day? Use Table 13.4 and
round-up rule.
Suppose the manager would like to have a 0.99 in-stock probability on demand
c. that occurs after 3 pm. How many bagels should the store have at 3 p.m. to
ensure that level of service? Use Table 13.4 and round-up rule.
Expert Solution
This question has been solved!
Explore an expertly crafted, step-by-step solution for a thorough understanding of key concepts.

This is a popular solution!

Trending now
This is a popular solution!

Step by step
Solved in 3 steps

Recommended textbooks for you
Practical Management Science
Operations Management
ISBN:
9781337406659
Author:
WINSTON, Wayne L.
Publisher:
Cengage,

Operations Management
Operations Management
ISBN:
9781259667473
Author:
William J Stevenson
Publisher:
McGraw-Hill Education

Operations and Supply Chain Management (Mcgraw-hi…
Operations Management
ISBN:
9781259666100
Author:
F. Robert Jacobs, Richard B Chase
Publisher:
McGraw-Hill Education
Practical Management Science
Operations Management
ISBN:
9781337406659
Author:
WINSTON, Wayne L.
Publisher:
Cengage,
Operations Management
Operations Management
ISBN:
9781259667473
Author:
William J Stevenson
Publisher:
McGraw-Hill Education
Operations and Supply Chain Management (Mcgraw-hi…
Operations Management
ISBN:
9781259666100
Author:
F. Robert Jacobs, Richard B Chase
Publisher:
McGraw-Hill Education


Purchasing and Supply Chain Management
Operations Management
ISBN:
9781285869681
Author:
Robert M. Monczka, Robert B. Handfield, Larry C. Giunipero, James L. Patterson
Publisher:
Cengage Learning

Production and Operations Analysis, Seventh Editi…
Operations Management
ISBN:
9781478623069
Author:
Steven Nahmias, Tava Lennon Olsen
Publisher:
Waveland Press, Inc.