How many of the lakes have E. coli levels greater than the mean? (Enter your answer as a whole number.) Number of lakes that have E.coli levels greater than the mean: What feature of the data explains the fact that the mean is greater than most of the observations? The mean is greater than most of the observations because it is greater than the median. The mean is greater than most of the observations because of the two outliers (291.0 and 190.4). The mean is greater than most of the observations because it is a resistant measure of center. The mean is greater than most of the observations because of the two outliers (1.0 and 8.6).

Algebra for College Students
10th Edition
ISBN:9781285195780
Author:Jerome E. Kaufmann, Karen L. Schwitters
Publisher:Jerome E. Kaufmann, Karen L. Schwitters
Chapter11: Systems Of Equations
Section11.CT: Test
Problem 24CT
icon
Related questions
icon
Concept explainers
Topic Video
Question
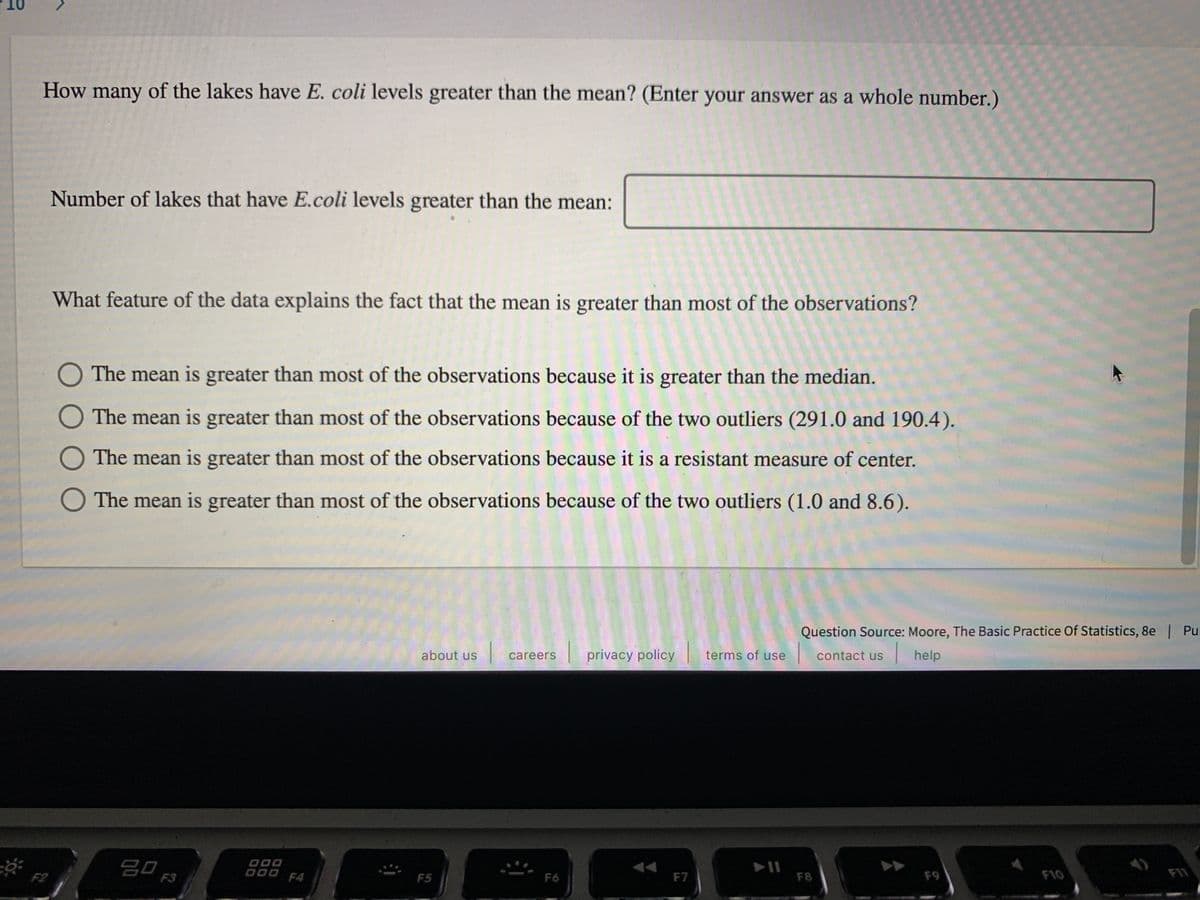
How many of the lakes have E. coli levels greater than the mean? (Enter your answer as a whole number.)
Number of lakes that have E.coli levels greater than the mean:
What feature of the data explains the fact that the mean is greater than most of the observations?
O The mean is greater than most of the observations because it is greater than the median.
O The mean is greater than most of the observations because of the two outliers (291.0 and 190.4).
O The mean is greater than most of the observations because it is a resistant measure of center.
O The mean is greater than most of the observations because of the two outliers (1.0 and 8.6).
Question Source: Moore, The Basic Practice Of Statistics, 8e | Pul
about us
privacy policy
terms of use
|help
careers
contact us
20
F3
D00
000 F4
F2
F5
F6
F7
F8
F9
F10
FI1
Transcribed Image Text:How many of the lakes have E. coli levels greater than the mean? (Enter your answer as a whole number.) Number of lakes that have E.coli levels greater than the mean: What feature of the data explains the fact that the mean is greater than most of the observations? O The mean is greater than most of the observations because it is greater than the median. O The mean is greater than most of the observations because of the two outliers (291.0 and 190.4). O The mean is greater than most of the observations because it is a resistant measure of center. O The mean is greater than most of the observations because of the two outliers (1.0 and 8.6). Question Source: Moore, The Basic Practice Of Statistics, 8e | Pul about us privacy policy terms of use |help careers contact us 20 F3 D00 000 F4 F2 F5 F6 F7 F8 F9 F10 FI1
10
>
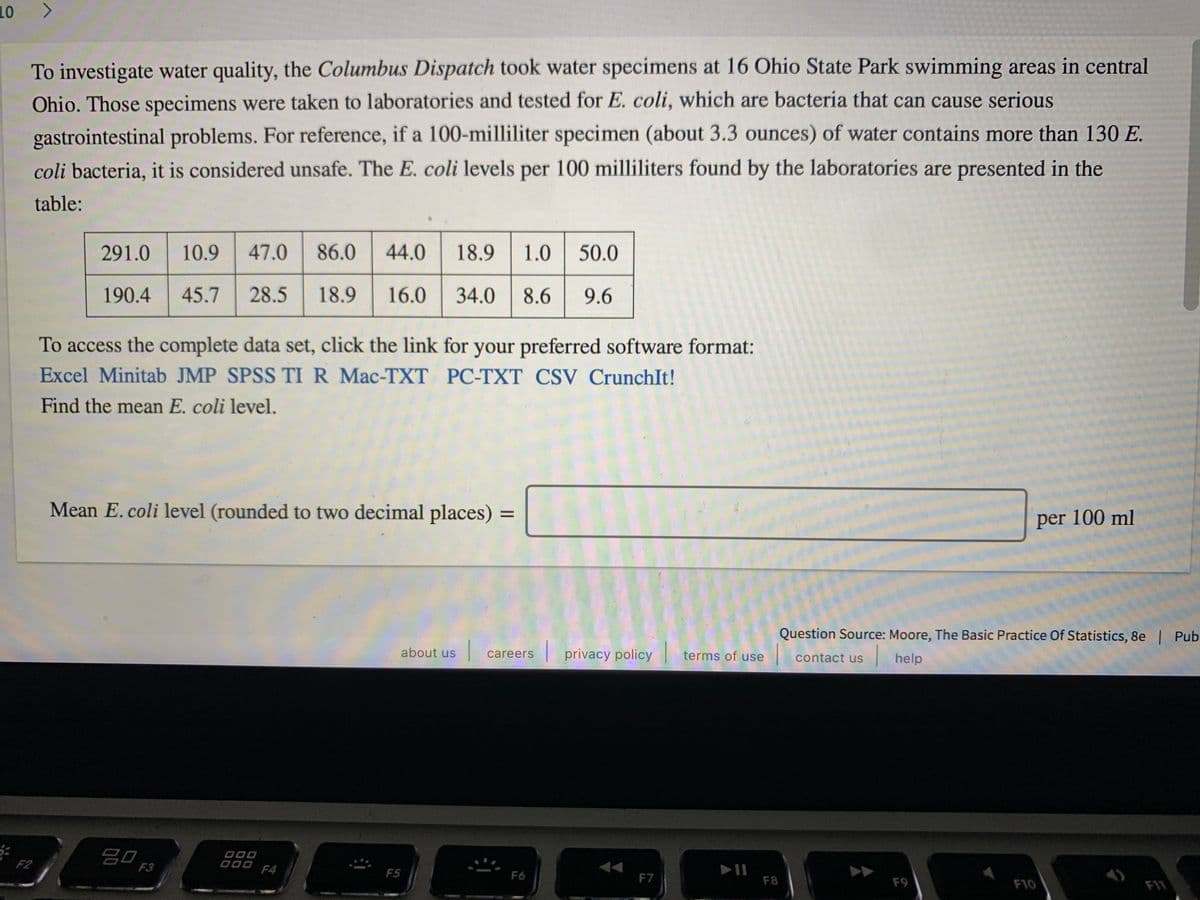
To investigate water quality, the Columbus Dispatch took water specimens at 16 Ohio State Park swimming areas in central
Ohio. Those specimens were taken to laboratories and tested for E. coli, which are bacteria that can cause serious
gastrointestinal problems. For reference, if a 100-milliliter specimen (about 3.3 ounces) of water contains more than 130 E.
coli bacteria, it is considered unsafe. The E. coli levels per 100 milliliters found by the laboratories are presented in the
table:
291.0
10.9
47.0
86.0
44.0
18.9
1.0
50.0
190.4
45.7
28.5
18.9
16.0
34.0
8.6
9.6
To access the complete data set, click the link for your preferred software format:
Excel Minitab JMP SPSS TI R Mac-TXT PC-TXT CSV CrunchIt!
Find the mean E. coli level.
Mean E.coli level (rounded to two decimal places)
%D
per 100 ml
Question Source: Moore, The Basic Practice Of Statistics, 8e | Pub
about us
privacy policy
terms of use
|help
careers
contact us
吕口
F3
D00 F4
F2
F5
F6
F7
F8
F9
F10
F11
Transcribed Image Text:10 > To investigate water quality, the Columbus Dispatch took water specimens at 16 Ohio State Park swimming areas in central Ohio. Those specimens were taken to laboratories and tested for E. coli, which are bacteria that can cause serious gastrointestinal problems. For reference, if a 100-milliliter specimen (about 3.3 ounces) of water contains more than 130 E. coli bacteria, it is considered unsafe. The E. coli levels per 100 milliliters found by the laboratories are presented in the table: 291.0 10.9 47.0 86.0 44.0 18.9 1.0 50.0 190.4 45.7 28.5 18.9 16.0 34.0 8.6 9.6 To access the complete data set, click the link for your preferred software format: Excel Minitab JMP SPSS TI R Mac-TXT PC-TXT CSV CrunchIt! Find the mean E. coli level. Mean E.coli level (rounded to two decimal places) %D per 100 ml Question Source: Moore, The Basic Practice Of Statistics, 8e | Pub about us privacy policy terms of use |help careers contact us 吕口 F3 D00 F4 F2 F5 F6 F7 F8 F9 F10 F11
Expert Solution
trending now

Trending now

This is a popular solution!

steps

Step by step

Solved in 2 steps

Blurred answer
Knowledge Booster
Centre, Spread, and Shape of a Distribution
Learn more about
Need a deep-dive on the concept behind this application? Look no further. Learn more about this topic, statistics and related others by exploring similar questions and additional content below.
Recommended textbooks for you
Algebra for College Students
Algebra
ISBN:
9781285195780
Author:
Jerome E. Kaufmann, Karen L. Schwitters
Publisher:
Cengage Learning
Linear Algebra: A Modern Introduction
Algebra
ISBN:
9781285463247
Author:
David Poole
Publisher:
Cengage Learning