How religious are the Filipinos? To answer this question, researchers at the Bicol University random survey of 4,004 people living in the islands of the Philippines. The results are s below. Construct a pie chart to illustrate the result then give interpretation. Number of Filipinos 2,005 1,555 Highly committed to religion Modestly religious Nominally religious Trace elements of religion Agnostic or atheist Total 688 258 104 4,610
How religious are the Filipinos? To answer this question, researchers at the Bicol University random survey of 4,004 people living in the islands of the Philippines. The results are s below. Construct a pie chart to illustrate the result then give interpretation. Number of Filipinos 2,005 1,555 Highly committed to religion Modestly religious Nominally religious Trace elements of religion Agnostic or atheist Total 688 258 104 4,610

Holt Mcdougal Larson Pre-algebra: Student Edition 2012
1st Edition
ISBN:9780547587776
Author:HOLT MCDOUGAL
Publisher:HOLT MCDOUGAL
Chapter9: Real Numbers And Right Triangles
Section9.4: Real Numbers
Problem 2E

Related questions
Question
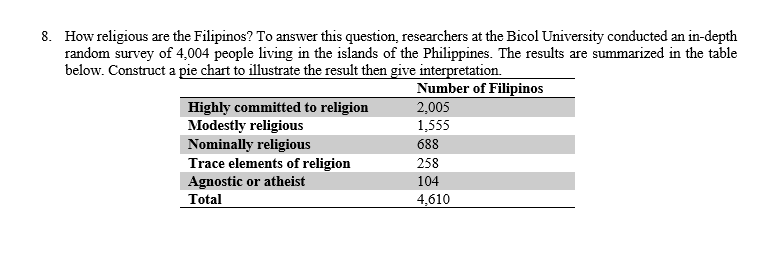
Transcribed Image Text:8. How religious are the Filipinos? To answer this question, researchers at the Bicol University conducted an in-depth
random survey of 4,004 people living in the islands of the Philippines. The results are summarized in the table
below. Construct a pie chart to illustrate the result then give interpretation.
Number of Filipinos
Highly committed to religion
Modestly religious
2,005
1,555
688
Nominally religious
Trace elements of religion
Agnostic or atheist
Total
258
104
4,610
Expert Solution
This question has been solved!
Explore an expertly crafted, step-by-step solution for a thorough understanding of key concepts.

Step by step
Solved in 2 steps with 2 images

Recommended textbooks for you
Holt Mcdougal Larson Pre-algebra: Student Edition…
Algebra
ISBN:
9780547587776
Author:
HOLT MCDOUGAL
Publisher:
HOLT MCDOUGAL
Holt Mcdougal Larson Pre-algebra: Student Edition…
Algebra
ISBN:
9780547587776
Author:
HOLT MCDOUGAL
Publisher:
HOLT MCDOUGAL