HYDROMETER ANALYSIS ORIGINAL SAMPLE: WASHED SAMPLE: 112.75 118.75 115.65 MASS CONTAINER MASS CONTAINER MASS SAMPLE DRY + CONTAINE 165.52 MASS DRY SAMPLE: (S) MASS SAMPLE DRY + CONTAINE 49.87 MASS RETD ON .075MM SIEVE 43.87 87.968719 MASS PASSING .075MM SIEVE 2.8 0.07 RD = % PASS .075MM SIEVE a HYDROMETER ANALYSIS: HYDROMETER TYPE 162H Elasped Time Hyd Сomection Corrected Clock Time Temp. "C Hyd. R Hyd R K Dia. D % smaller P 87.969 0.0750 0.4171 0.2975 0.2122 0.1575 0.1168 0.0852 0.0618 36 35 34 11.5 11.7 -7 -7 -7 -7 -7 -7 -7 -7 -7 -7 1 2 29 28 27 0.123 0.123 0.123 25 56.407 54.462 25 4 25 11.9 52.517 8. 15 30 23 23 22 22 22 30 28 25 21 18 23 21 18 12.5 12.9 13.3 14 14.5 0.126 0.126 0.128 0.128 0.128 0.128 0.128 44.736 40.846 35.011 27.231 21.396 13.615 60 14 120 0.0445 0.0322 0.0133 11 15.2 15.6 240 22 14 1440 22 11 7.780 GRAIN SIZE DISTRIBUTION 100.00 90.00 80.00 70.00 60.00 50.00 40.00 30.00 20.00 10.00 0.00 0.0100 +++ 0.1000 1.0000 PARTICLE SIZE % SMALLER
HYDROMETER ANALYSIS ORIGINAL SAMPLE: WASHED SAMPLE: 112.75 118.75 115.65 MASS CONTAINER MASS CONTAINER MASS SAMPLE DRY + CONTAINE 165.52 MASS DRY SAMPLE: (S) MASS SAMPLE DRY + CONTAINE 49.87 MASS RETD ON .075MM SIEVE 43.87 87.968719 MASS PASSING .075MM SIEVE 2.8 0.07 RD = % PASS .075MM SIEVE a HYDROMETER ANALYSIS: HYDROMETER TYPE 162H Elasped Time Hyd Сomection Corrected Clock Time Temp. "C Hyd. R Hyd R K Dia. D % smaller P 87.969 0.0750 0.4171 0.2975 0.2122 0.1575 0.1168 0.0852 0.0618 36 35 34 11.5 11.7 -7 -7 -7 -7 -7 -7 -7 -7 -7 -7 1 2 29 28 27 0.123 0.123 0.123 25 56.407 54.462 25 4 25 11.9 52.517 8. 15 30 23 23 22 22 22 30 28 25 21 18 23 21 18 12.5 12.9 13.3 14 14.5 0.126 0.126 0.128 0.128 0.128 0.128 0.128 44.736 40.846 35.011 27.231 21.396 13.615 60 14 120 0.0445 0.0322 0.0133 11 15.2 15.6 240 22 14 1440 22 11 7.780 GRAIN SIZE DISTRIBUTION 100.00 90.00 80.00 70.00 60.00 50.00 40.00 30.00 20.00 10.00 0.00 0.0100 +++ 0.1000 1.0000 PARTICLE SIZE % SMALLER

Chapter2: Loads On Structures
Section: Chapter Questions
Problem 1P

Related questions

Question
Determine the percentage of sand, silt and clay using the MIT soil classification system from the figure below.
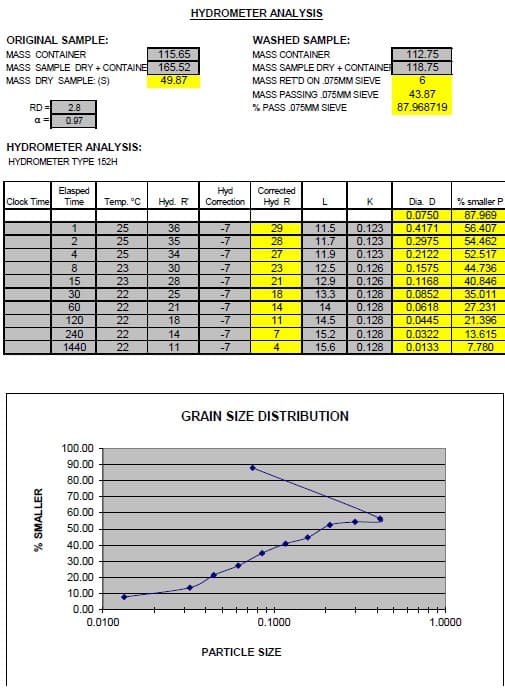
Transcribed Image Text:HYDROMETER ANALYSIS
ORIGINAL SAMPLE:
WASHED SAMPLE:
115.65
MASS SAMPLE DRY + CONTAINE 165.52
49.87
112.75
118.75
MASS CONTAINER
MASS CONTAINER
MASS SAMPLE DRY + CONTAINE
MASS DRY SAMPLE: (S)
MASS RETD ON .075MM SIEVE
MASS PASSING .075MM SIEVE
43.87
RD =
2.8
% PASS .075MM SIEVE
87.968719
a =
0.97
HYDROMETER ANALYSIS:
HYDROMETER TYPE 152H
Elasped
Time
Hyd
Correction
Corrected
Clock Time
Temp. °C
Hyd. R
Hyd R
K
Dia. D
% smaller P
0.0750
87.969
56.407
54.462
25
36
-7
29
11.5
11.7
11.9
0.123
0.4171
0.2975
25
25
35
-7
28
0.123
4
34
-7
27
0.123
0.2122
52.517
8.
23
30
-7
23
12.5
0.126
0.1575
0.1168
0.0852
44.736
40.846
15
23
22
22
22
22
22
28
-7
21
12.9
0.126
25
21
30
-7
18
14
11
13.3
0.128
0.128
35.011
60
-7
14
0.0618
27.231
120
18
-7
14.5
0.128
0.0445
21.396
240
14
-7
7
15.2
0.128
0.0322
13.615
7.780
1440
11
-7
15.6
0.128
0.0133
GRAIN SIZE DISTRIBUTION
100.00
90.00
80.00
70.00
60.00
50.00
40.00
30.00
20.00
10.00
0.00
0.0100
0.1000
1.0000
PARTICLE SIZE
% SMALLER
Expert Solution
This question has been solved!
Explore an expertly crafted, step-by-step solution for a thorough understanding of key concepts.

Step by step
Solved in 2 steps

Knowledge Booster


Learn more about
Need a deep-dive on the concept behind this application? Look no further. Learn more about this topic, civil-engineering and related others by exploring similar questions and additional content below.Recommended textbooks for you

Structural Analysis (10th Edition)
Civil Engineering
ISBN:
9780134610672
Author:
Russell C. Hibbeler
Publisher:
PEARSON

Principles of Foundation Engineering (MindTap Cou…
Civil Engineering
ISBN:
9781337705028
Author:
Braja M. Das, Nagaratnam Sivakugan
Publisher:
Cengage Learning
Structural Analysis (10th Edition)
Civil Engineering
ISBN:
9780134610672
Author:
Russell C. Hibbeler
Publisher:
PEARSON
Principles of Foundation Engineering (MindTap Cou…
Civil Engineering
ISBN:
9781337705028
Author:
Braja M. Das, Nagaratnam Sivakugan
Publisher:
Cengage Learning

Fundamentals of Structural Analysis
Civil Engineering
ISBN:
9780073398006
Author:
Kenneth M. Leet Emeritus, Chia-Ming Uang, Joel Lanning
Publisher:
McGraw-Hill Education


Traffic and Highway Engineering
Civil Engineering
ISBN:
9781305156241
Author:
Garber, Nicholas J.
Publisher:
Cengage Learning