I am having a hard time solving a? I am struggling to understand this question. Can you please show me how to solve this question step by step and be very detailed about it, how you were able to do so, and what you used to get these answers? My class is using the Simple linear Regression in excel method I do I used that to get the answer for this problem below? When survey data indicated that a coffee company needed to improve its package-sealing process, an experiment was conducted to determine the factors in the bag-sealing equipment that might be affecting the ease of opening the bags without tearing the inner liner of the bag. Data were collected on 19 bags and the plate gap on the bag-sealing equipment was used to predict the tear rating of a bag. b. Construct a 95% predicition interval es


I am having a hard time solving a? I am struggling to understand this question. Can you please show me how to solve this question step by step and be very detailed about it, how you were able to do so, and what you used to get these answers? My class is using the Simple linear Regression in excel method I do I used that to get the answer for this problem below?
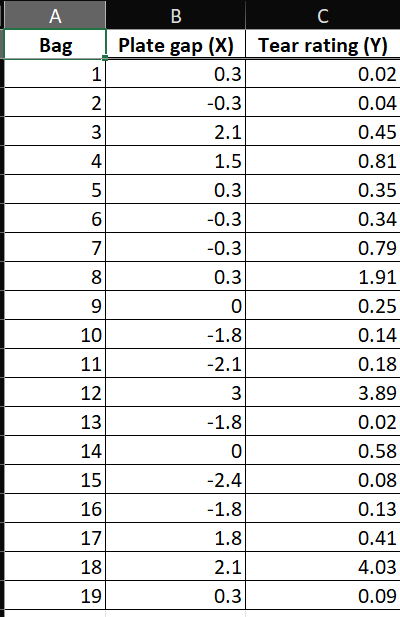
When survey data indicated that a coffee company needed to improve its package-sealing process, an experiment was conducted to determine the factors in the bag-sealing equipment that might be affecting the ease of opening the bags without tearing the inner liner of the bag. Data were collected on 19 bags and the plate gap on the bag-sealing equipment was used to predict the tear rating of a bag.
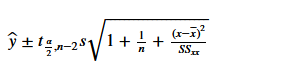
b.
Formula:
Excel Procedure:
- Enter X and Y data in Excel
- Go to Data
- Click on Data Analysis……..> ‘Regression’.
- Select Y under ‘Input Y Range’.
- Select X under ‘Input X Range’.
- Click on ‘OK’.
Output:
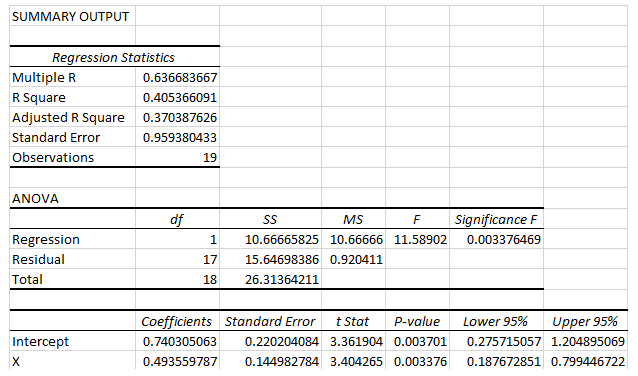
From the given output,
The regression equation is,
Y=0.7403+0.4936X.
If X=0, then Y=0.7403+(0.4936*0)=0.7403.

Trending now
This is a popular solution!

Step by step
Solved in 2 steps with 3 images
