I have created two Box plot charts for my Sale transactions Dataset. But I need an interpretation for each of them to add to my repor
I have created two Box plot charts for my Sale transactions Dataset. But I need an interpretation for each of them to add to my repor

Algebra & Trigonometry with Analytic Geometry
13th Edition
ISBN:9781133382119
Author:Swokowski
Publisher:Swokowski
Chapter2: Equations And Inequalities
Section2.1: Equations
Problem 70E

Related questions
Question
I have created two Box plot charts for my Sale transactions Dataset. But I need an interpretation for each of them to add to my report.
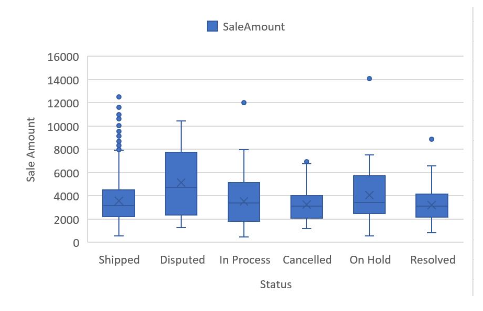
Transcribed Image Text:Sale Amount
16000
14000
12000
10000
8000
6000
4000
2000
0
●●00000000
SaleAmount
Shipped Disputed In Process Cancelled
Status
On Hold
Resolved
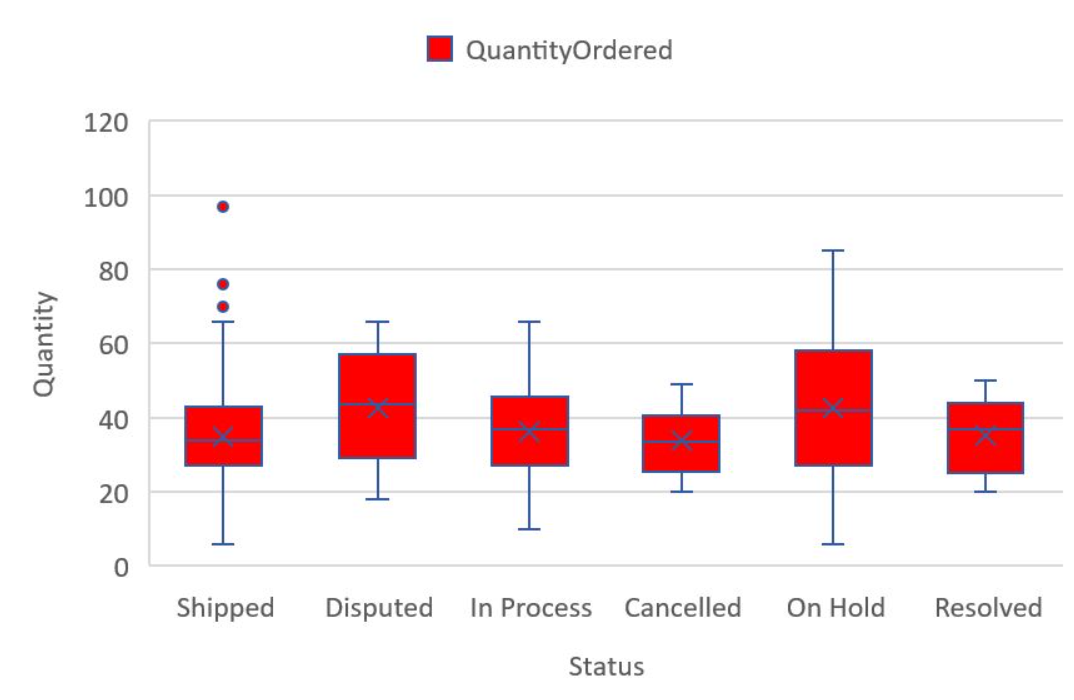
Transcribed Image Text:Quantity
120
100
80
60
40
20
0
Shipped
Disputed
QuantityOrdered
In Process
T
Cancelled
Status
On Hold
Resolved
Expert Solution
This question has been solved!
Explore an expertly crafted, step-by-step solution for a thorough understanding of key concepts.

Step by step
Solved in 4 steps

Recommended textbooks for you
Algebra & Trigonometry with Analytic Geometry
Algebra
ISBN:
9781133382119
Author:
Swokowski
Publisher:
Cengage
Algebra & Trigonometry with Analytic Geometry
Algebra
ISBN:
9781133382119
Author:
Swokowski
Publisher:
Cengage