(i) (ii) (iii) (g) Draw an appropriate network diagram to correctly represent the project. Calculate the Earliest start time, the Earliest finishing time, the Latest start time, the Latest finishing and the Float for each activity. Identify the critical path and calculate the overall project completion time. Explain clearly (with reasons) the effect upon the overall project completion time if the completion time for activity I increases from 2 weeks to 3 weeks while at the same time the completion time for activity G increases from 4 weeks to 7 weeks.
(i) (ii) (iii) (g) Draw an appropriate network diagram to correctly represent the project. Calculate the Earliest start time, the Earliest finishing time, the Latest start time, the Latest finishing and the Float for each activity. Identify the critical path and calculate the overall project completion time. Explain clearly (with reasons) the effect upon the overall project completion time if the completion time for activity I increases from 2 weeks to 3 weeks while at the same time the completion time for activity G increases from 4 weeks to 7 weeks.

Practical Management Science
6th Edition
ISBN:9781337406659
Author:WINSTON, Wayne L.
Publisher:WINSTON, Wayne L.
Chapter2: Introduction To Spreadsheet Modeling
Section: Chapter Questions
Problem 20P: Julie James is opening a lemonade stand. She believes the fixed cost per week of running the stand...

Related questions
Question
please answer all parts of the question within 30 minutes with detailed explanation and caluculations. Make sure all the answers are in detailed manner for better understanding. Else i will give negative ratings.
Transcribed Image Text:(i)
(ii)
(iii)
(g)
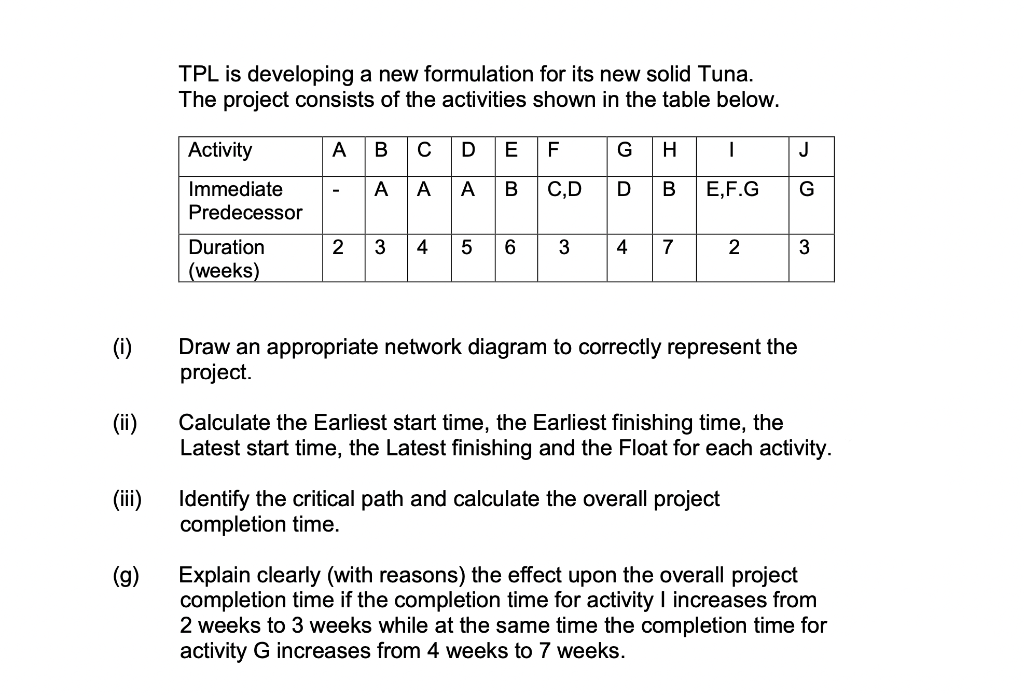
TPL is developing a new formulation for its new solid Tuna.
The project consists of the activities shown in the table below.
Activity
A B с D
E
F
G H
|
J
Immediate
A A A
B
C,D
D B
E,F.G
G
Predecessor
Duration
2 3
4 5 6
3
4 7
2
3
(weeks)
Draw an appropriate network diagram to correctly represent the
project.
Calculate the Earliest start time, the Earliest finishing time, the
Latest start time, the Latest finishing and the Float for each activity.
Identify the critical path and calculate the overall project
completion time.
Explain clearly (with reasons) the effect upon the overall project
completion time if the completion time for activity I increases from
2 weeks to 3 weeks while at the same time the completion time for
activity G increases from 4 weeks to 7 weeks.
Expert Solution
This question has been solved!
Explore an expertly crafted, step-by-step solution for a thorough understanding of key concepts.

Step by step
Solved in 5 steps with 3 images

Recommended textbooks for you
Practical Management Science
Operations Management
ISBN:
9781337406659
Author:
WINSTON, Wayne L.
Publisher:
Cengage,

Operations Management
Operations Management
ISBN:
9781259667473
Author:
William J Stevenson
Publisher:
McGraw-Hill Education

Operations and Supply Chain Management (Mcgraw-hi…
Operations Management
ISBN:
9781259666100
Author:
F. Robert Jacobs, Richard B Chase
Publisher:
McGraw-Hill Education
Practical Management Science
Operations Management
ISBN:
9781337406659
Author:
WINSTON, Wayne L.
Publisher:
Cengage,
Operations Management
Operations Management
ISBN:
9781259667473
Author:
William J Stevenson
Publisher:
McGraw-Hill Education
Operations and Supply Chain Management (Mcgraw-hi…
Operations Management
ISBN:
9781259666100
Author:
F. Robert Jacobs, Richard B Chase
Publisher:
McGraw-Hill Education


Purchasing and Supply Chain Management
Operations Management
ISBN:
9781285869681
Author:
Robert M. Monczka, Robert B. Handfield, Larry C. Giunipero, James L. Patterson
Publisher:
Cengage Learning

Production and Operations Analysis, Seventh Editi…
Operations Management
ISBN:
9781478623069
Author:
Steven Nahmias, Tava Lennon Olsen
Publisher:
Waveland Press, Inc.